
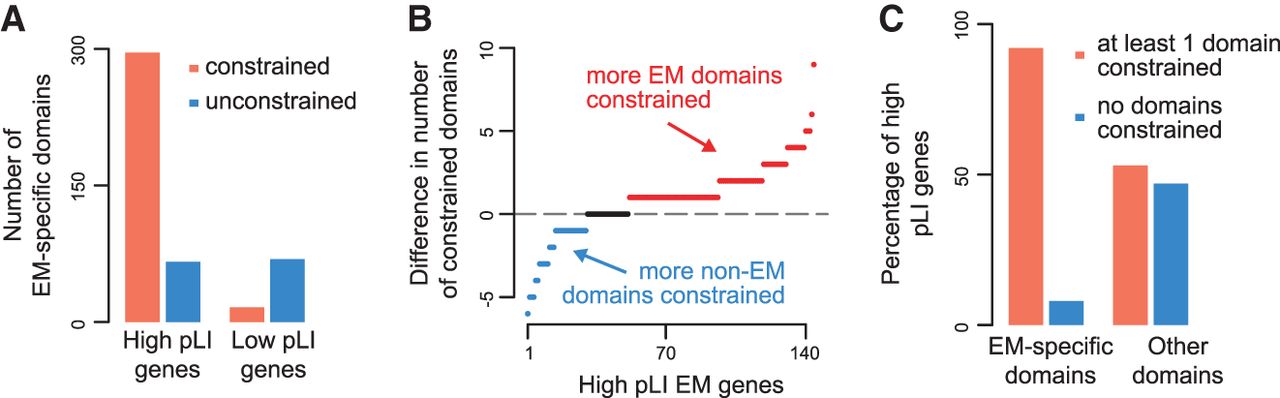
The protein domains known to mediate epigenetic functions drive the observed constraint of EM genes. (A) The number of constrained and unconstrained EM-specific protein domains of high pLI (>0.9) EM genes versus low pLI (<0.1) EM genes. (B) The within-gene differences in the total number of EM-specific constrained domains versus other constrained domains. Each dot corresponds to a gene. Red dots indicate genes with more EM-specific constrained domains; blue dots indicate genes with more other constrained domains; black dots indicate genes with an equal number of constrained EM-specific and other domains. (C) The percentage of high pLI EM genes with at least one constrained EM-specific domain versus the corresponding percentage with at least one constrained other domain.


