
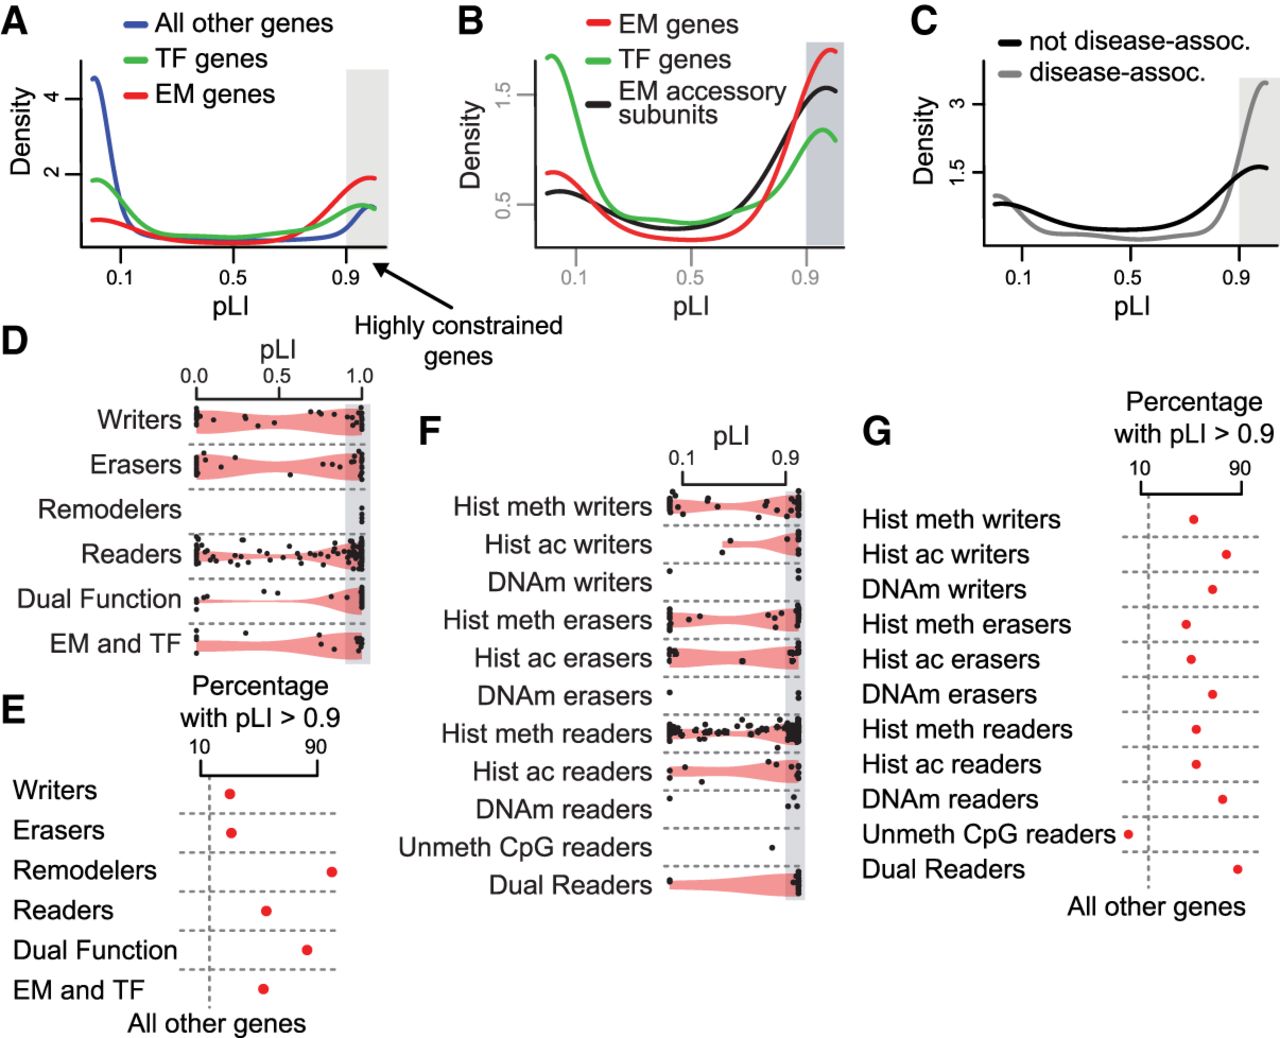
A large subset of epigenetic regulators are very intolerant to variation. (A) The pLI distributions of EM genes (red curve), TF genes (green curve), and all other genes (blue curve). (B) The pLI distributions of EM genes (red curve), genes encoding for accessory subunits of EM protein complexes (black curve), and TF genes (green curve). (C) The pLI distribution of disease-associated EM genes versus non-disease–associated EM genes. (D–G) The pLI distributions (D,F) and percentage of genes with pLI > 0.9 (E,G) of individual classes of EM genes. The shaded gray area (A–D,F) indicates highly constrained genes (>0.9). The vertical dashed gray line (E,G) corresponds to the percentage of all other genes with pLI > 0.9.


