
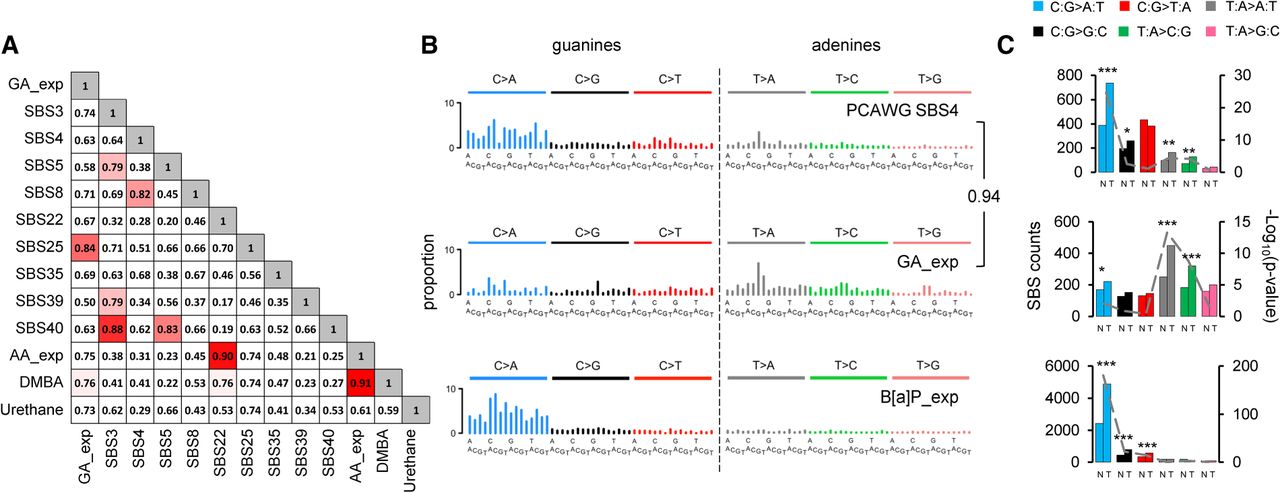
Comparison of GA signature to known signatures. (A) Cosine similarity matrix comparing GA mutational signature with the human PCAWG data (SBS3, -4, -5, -8, -22, -25, -35, -39, and -40) and other A > T-rich mutational signatures from experimental exposure assays using specific carcinogens (7,12-dimethylbenz[a]anthracene [DMBA], urethane, and aristolochic acid [AA]). (B) Comparison of PCAWG SBS4 with two experimentally derived signatures: B[a]P_exp = benzo[a]pyrene mutational signature extracted from HMECs; GA_exp = GA mutational signature extracted from MEF cells. Cosine similarity between the T > N (adenine) components of SBS4 and GA signature is shown on the right. (C) Transcription strand bias analysis for the six mutation types underlying the signatures in panel B. For each mutation type (using the pyrimidine convention), the number of mutations occurring on the transcribed (T) and nontranscribed (N) strand is shown on the left y-axis. The significance is expressed as –log10(P-value) indicated on the right y-axis. (***) P < 10−8, (**) P < 10−4, (*) P < 10−2.


