
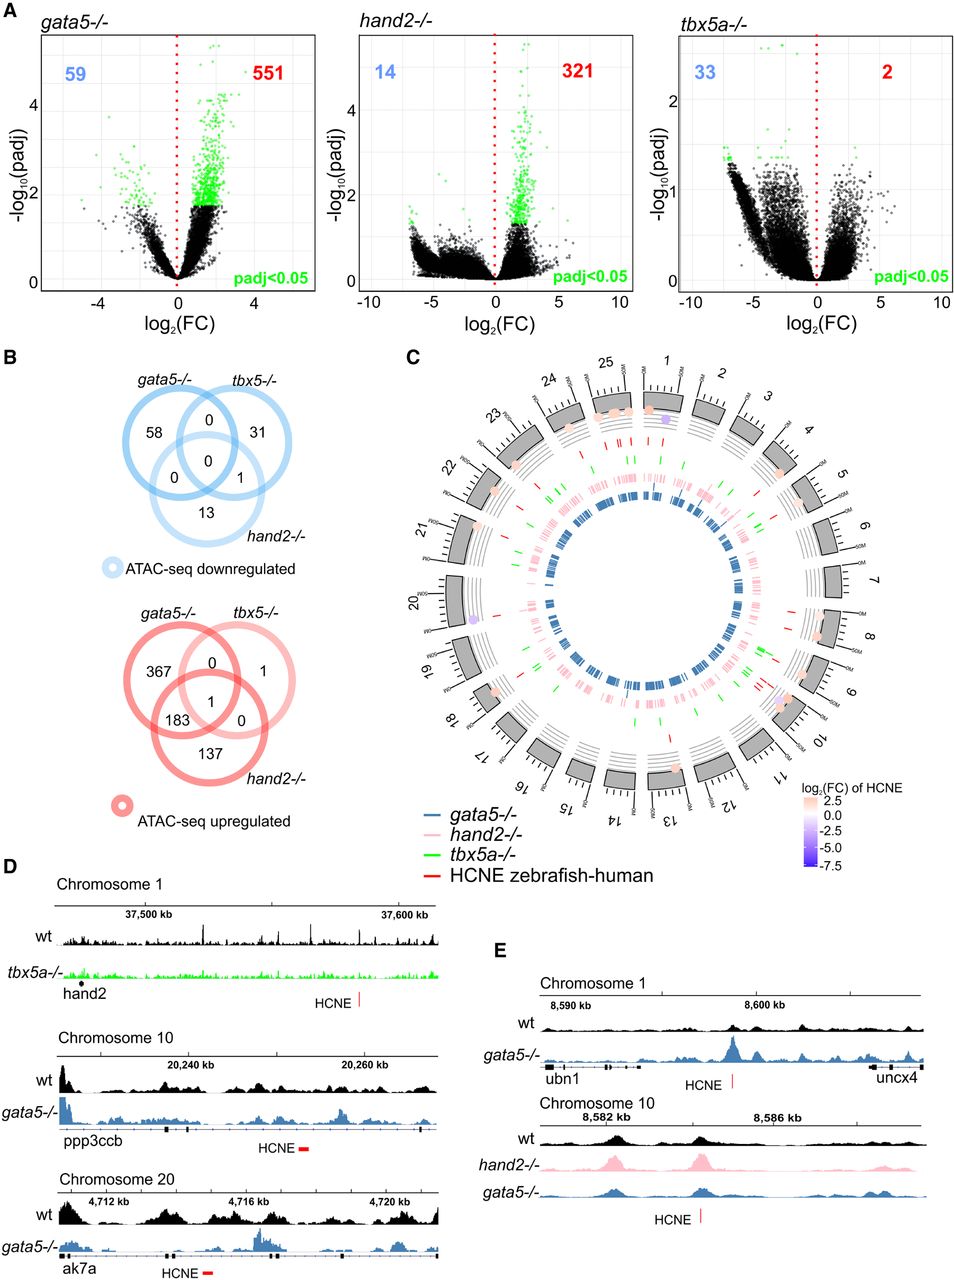
Identification of putative cardiac enhancers. (A) A volcano plot of differentially accessible distal NFRs between wild-type and TF mutants at 72 hpf. Adjusted P-value ≤ 0.05 are indicated in green, the number of down-regulated NFRs is indicated in blue, and up-regulated NFRs in red. (B) Venn diagram of mutant down- and up-regulated distal NFRs (more than ±3 kb of TSS); adjusted P-value ≤ 0.05. (C) Graphical representation of differentially accessible distal NFRs genomic localization onto zebrafish chromosomes. NFRs overlapping with HCNE (±500 bp) and their accessibility log2FC in comparison to wild type is indicated; adjusted P-value < 0.05. (D) Genome track of ATAC-seq peaks for wild type (black), tbx5a−/− (green), and gata5−/− (blue) for the three most down-regulated NFRs overlapping with HCNE (±500 bp). (E) Genome track of ATAC-seq peaks for wild type (black), hand2−/− (pink), and gata5−/− (blue) of the three most up-regulated NFRs overlapping with HCNE (±500 bp).


