
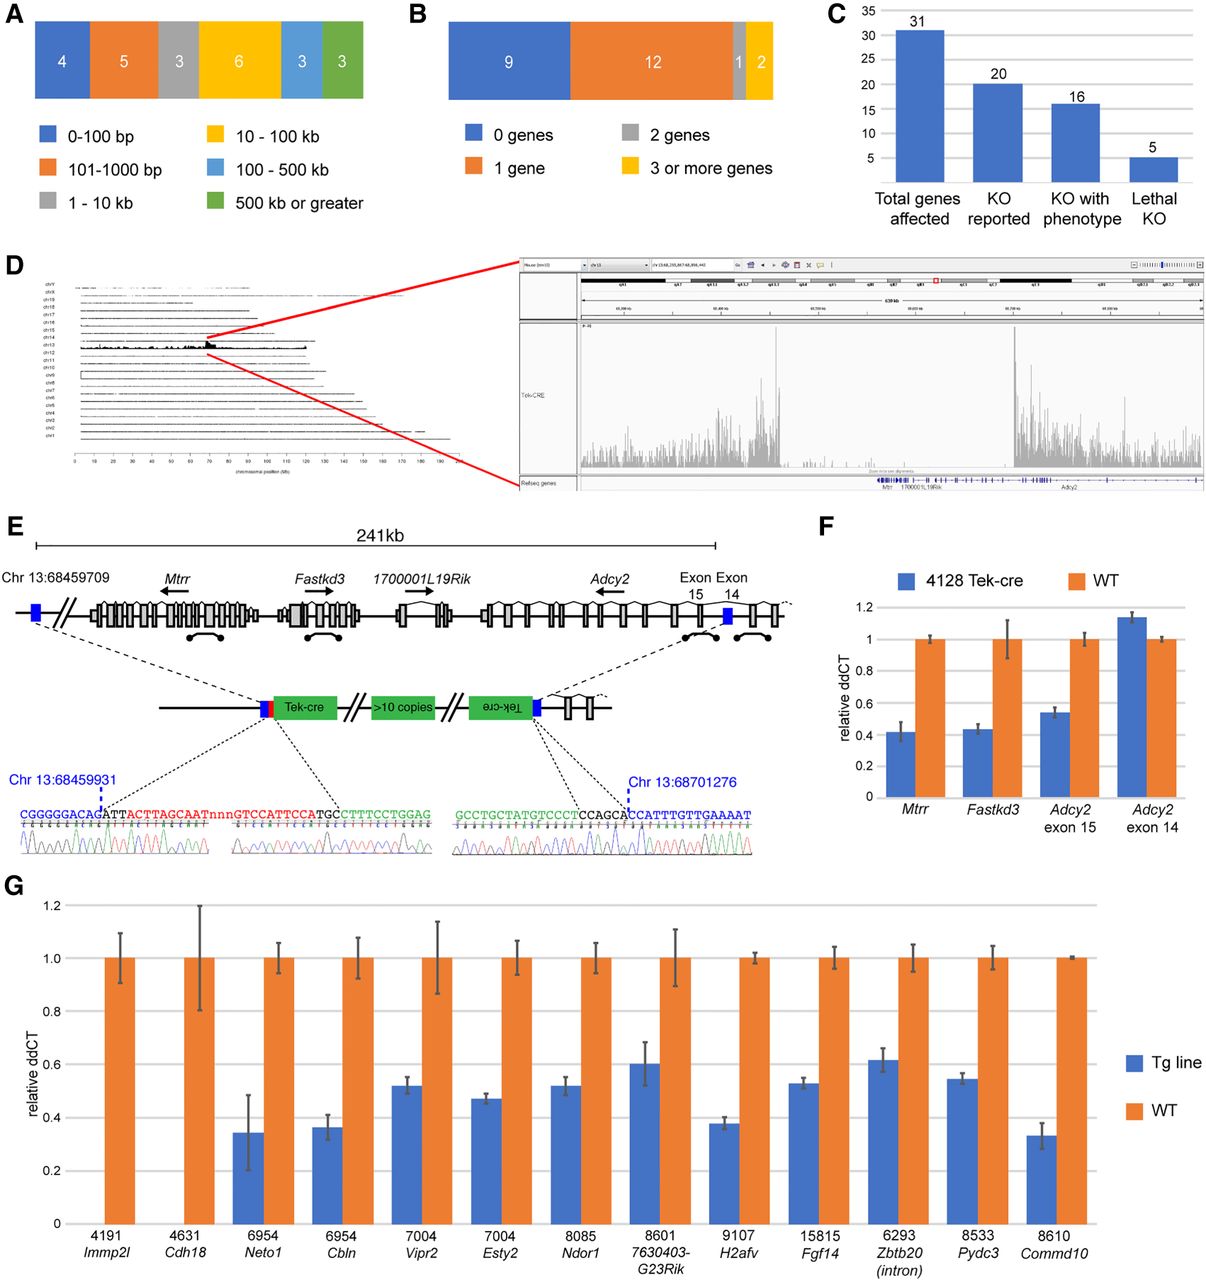
Deletions accompanying transgenic insertions. (A) Profile of sizes of deletions identified at integration loci. (B) For integrations that occur in genes, the profile of the number of genes affected by the insertion event. (C) Illustration of the potential impact of transgene insertions into genes, including the number of genes with reported knockout (KO) alleles, the number of KO alleles with a reported phenotype, and number of genes shown to be essential for life. (D) Genome-wide and zoomed Chr 13 view of TLA reads mapped to the mouse genome. (E) Schematic of the insertion locus in the Tek-cre [Tg(Tek-cre)12Flv] line. Blue bars indicate the 5′ and 3′ limits of the deleted region, with the relative orientation of transgene copies adjacent to the breakpoint as determined from sequence-confirmed fusion fragments. Locations of qPCR probes to confirm copy number are shown. (F) Results of LOA qPCR assays showing the expected loss of one copy of Mtrr and Fastkd3 and exon 15 of Adcy2, which lie within the deletion. Adcy2 exon 14, which lies outside of the deletion, has the expected two copies. WT copy number is arbitrarily set at 1, thus a value of 0.5 would indicate loss of one copy. (G) LOA assays for 13 other genes/loci deletions identified in this study. Strains are indicated by Stock # above the gene symbol for each test. For strains 4191 and 4631, the complete loss of Immp2l and Cdh18, respectively, is consistent with the homozygous maintenance of these lines.


