
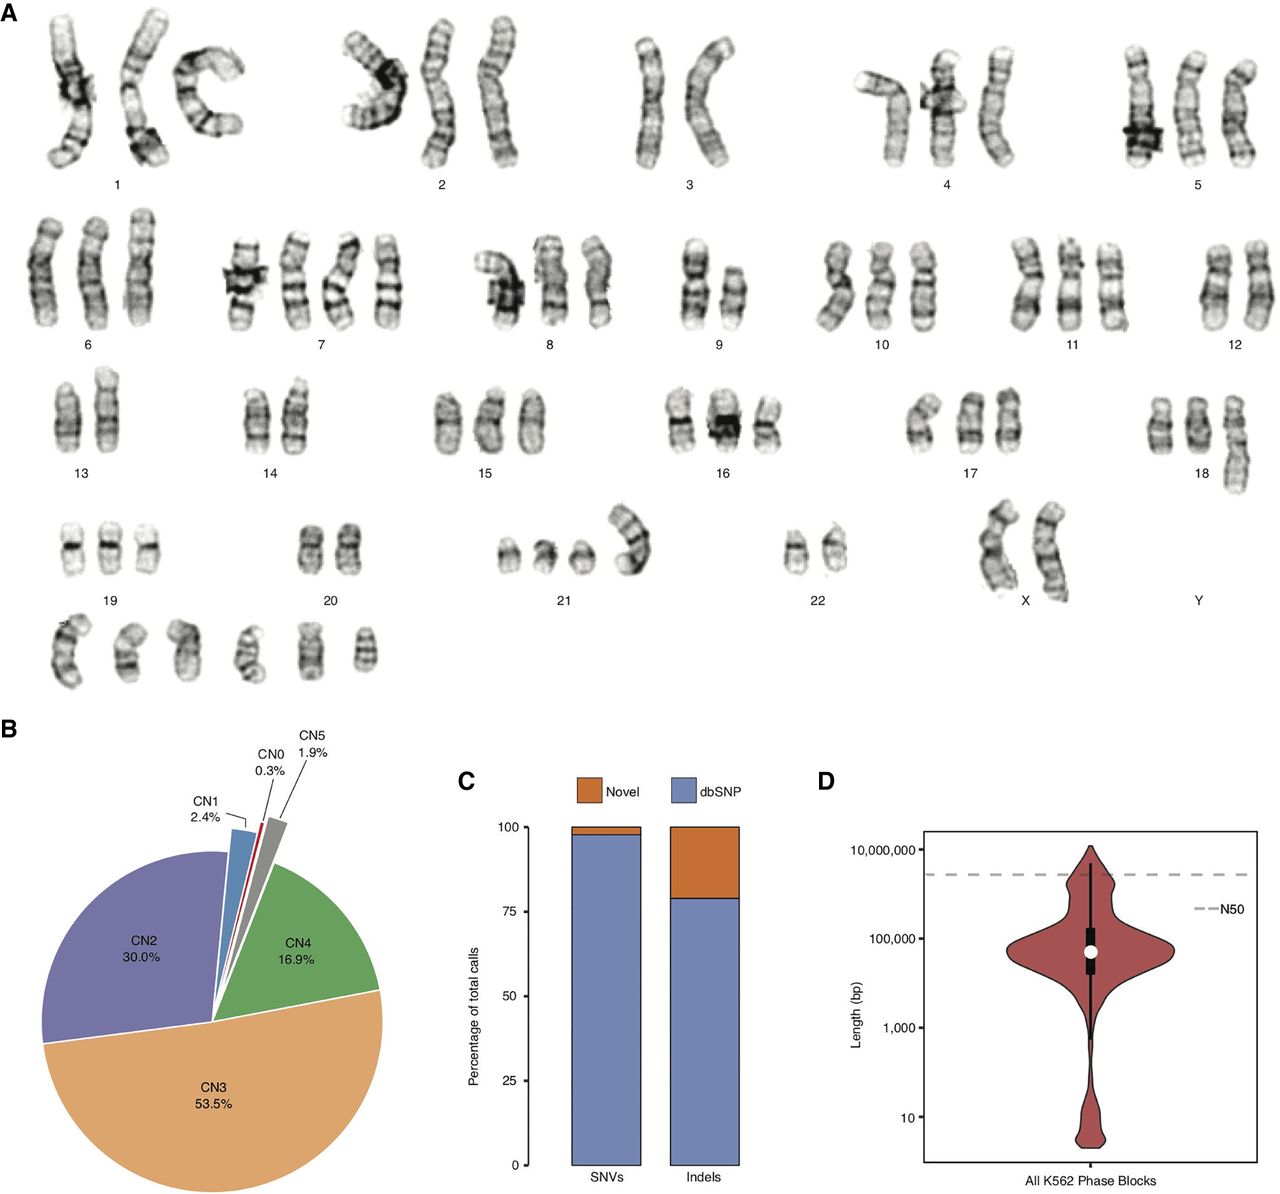
K562 ploidy and haplotypes. (A) Representative karyogram of K562 cells produced by GTW banding showing multiple numerical and structural chromosomal abnormalities and an overall near-triploid karyotype. ISCN 2013 description in relationship to a triploid karyotype [<3n>]: 53∼70<3n>,XX,-X or Y,-3,?dup(6)(p21p25),+7,?inv(7)(p13p22),add(7)(q32),-9,add(9)(p24),del(9)(p13),add(10)(q22),-13,add(13)(p11),-14,add(17)(p11.2)x2,add(18)(q23),-20,der(21)t(1;21)(q21;p11),-22,+4∼7mar[cp20]. (B) CN (i.e., ploidy) by percentage across the K562 genome. (C) Percentage of K562 SNVs and indels that are novel and known in dbSNP (Sherry et al. 2001). (D) Violin plot, with overlaid box plot, of phased haplotype block sizes (y-axis, log-scaled) in which the dashed line represents the N50 value (2,721,866 bp).


