
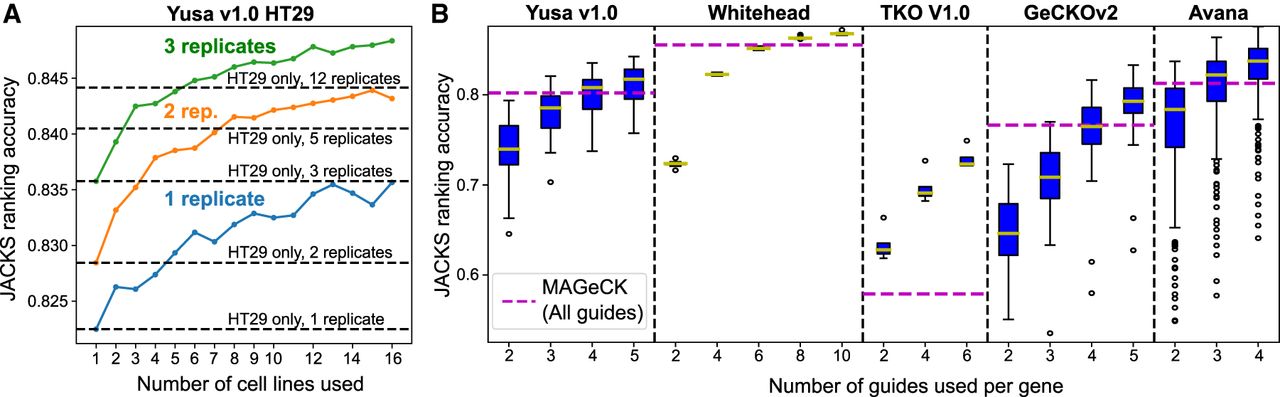
JACKS enables reduced screen size and cost. (A) Average JACKS ranking accuracy (y-axis) on HT29 cell line for increasing numbers of coprocessed cell lines (x-axis), and different number of technical replicates (colors). Two hundred cell lines were randomly sampled for each point on the graph and results averaged. As a reference, the same metric is plotted in increasing numbers of HT29 replicates (y-axis) processed by JACKS without the other cell lines (dashed lines). (B) JACKS ranking accuracy (y-axis) for increasing numbers of gRNAs (x-axis) from five different libraries (panels) using two replicates per cell line, compared to MAGeCK used on all five gRNAs and all available (two to four per cell line) replicates (dashed line). Box plot as in Figure 1C.


