
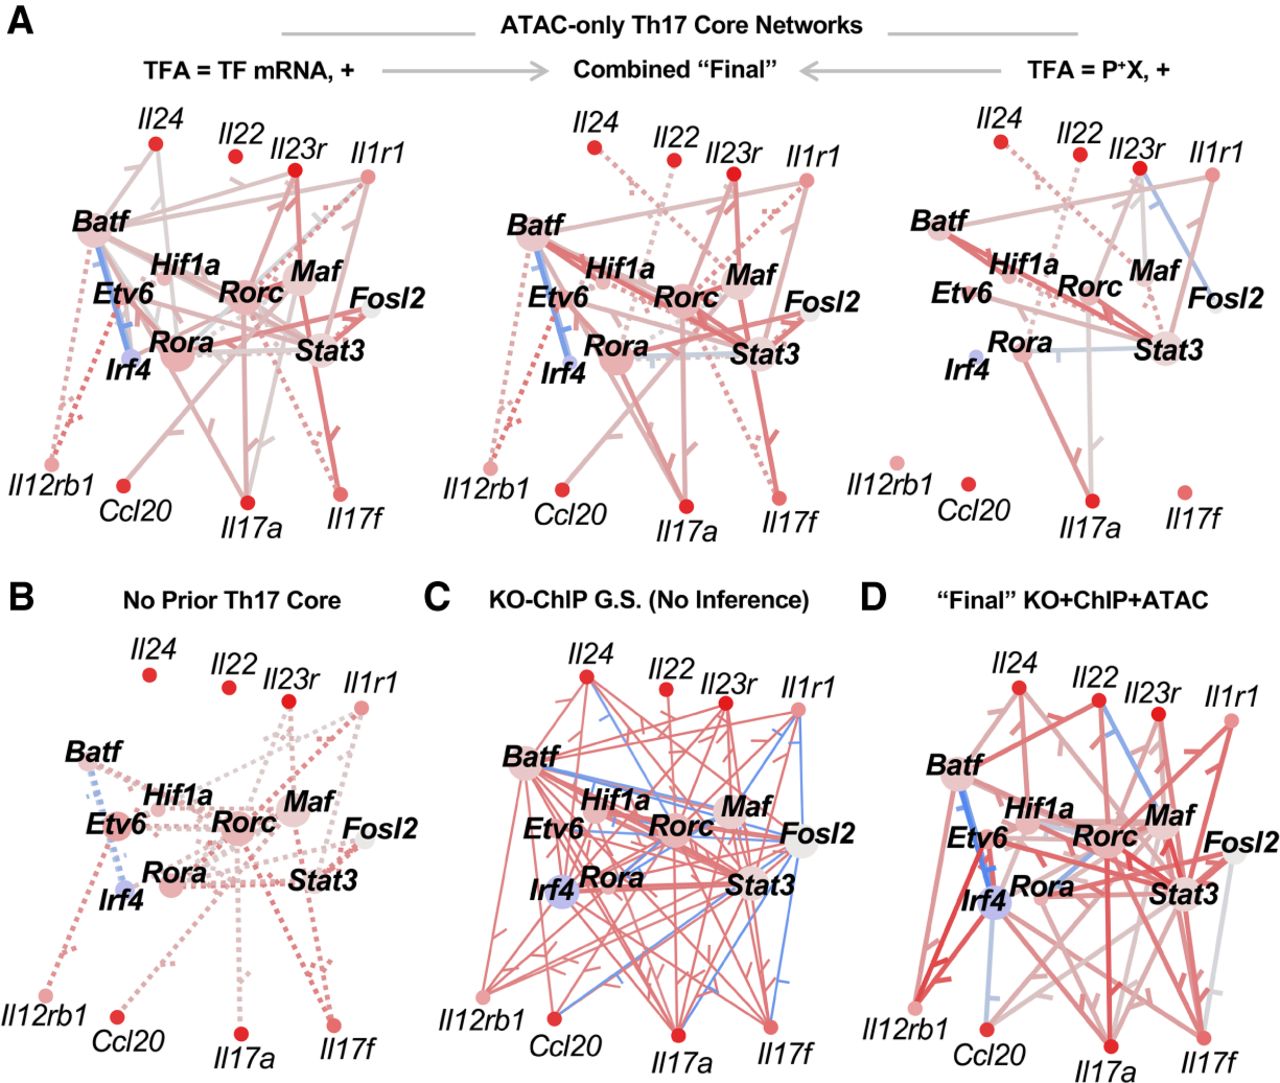
The Th17 TRNs recover key TF–gene interactions from the literature. (A–D) Th17 core TRN models. “Core” Th17 genes and TFs were selected from the literature for visual comparison with jp_gene_viz software. Network size was limited to an average of 15 TFs per gene for Inferelator networks using the following: (A) Th17 ATAC prior; (B) no prior; or (D) ChIP + ATAC + KO prior. The edges in Inferelator TRNs are colored according to partial correlation (red indicates positive; blue, negative) and weighted proportionally to edge stability. Solid edges have prior support, whereas dotted edges were learned from gene expression modeling alone. (C) The full KO-ChIP GS from Ciofani et al. (2012), where edge sign is based on differential gene expression analysis between TF KO and control. Nodes are colored according to z-scored gene expression at 48 h in Th17, relative to the other Th cell time points (red/blue indicates increased/decreased expression). The “final” KO + ChIP + ATAC (D) and ATAC-only (B) TRNs max-combine networks built using TF mRNA and prior-based TFA.


