
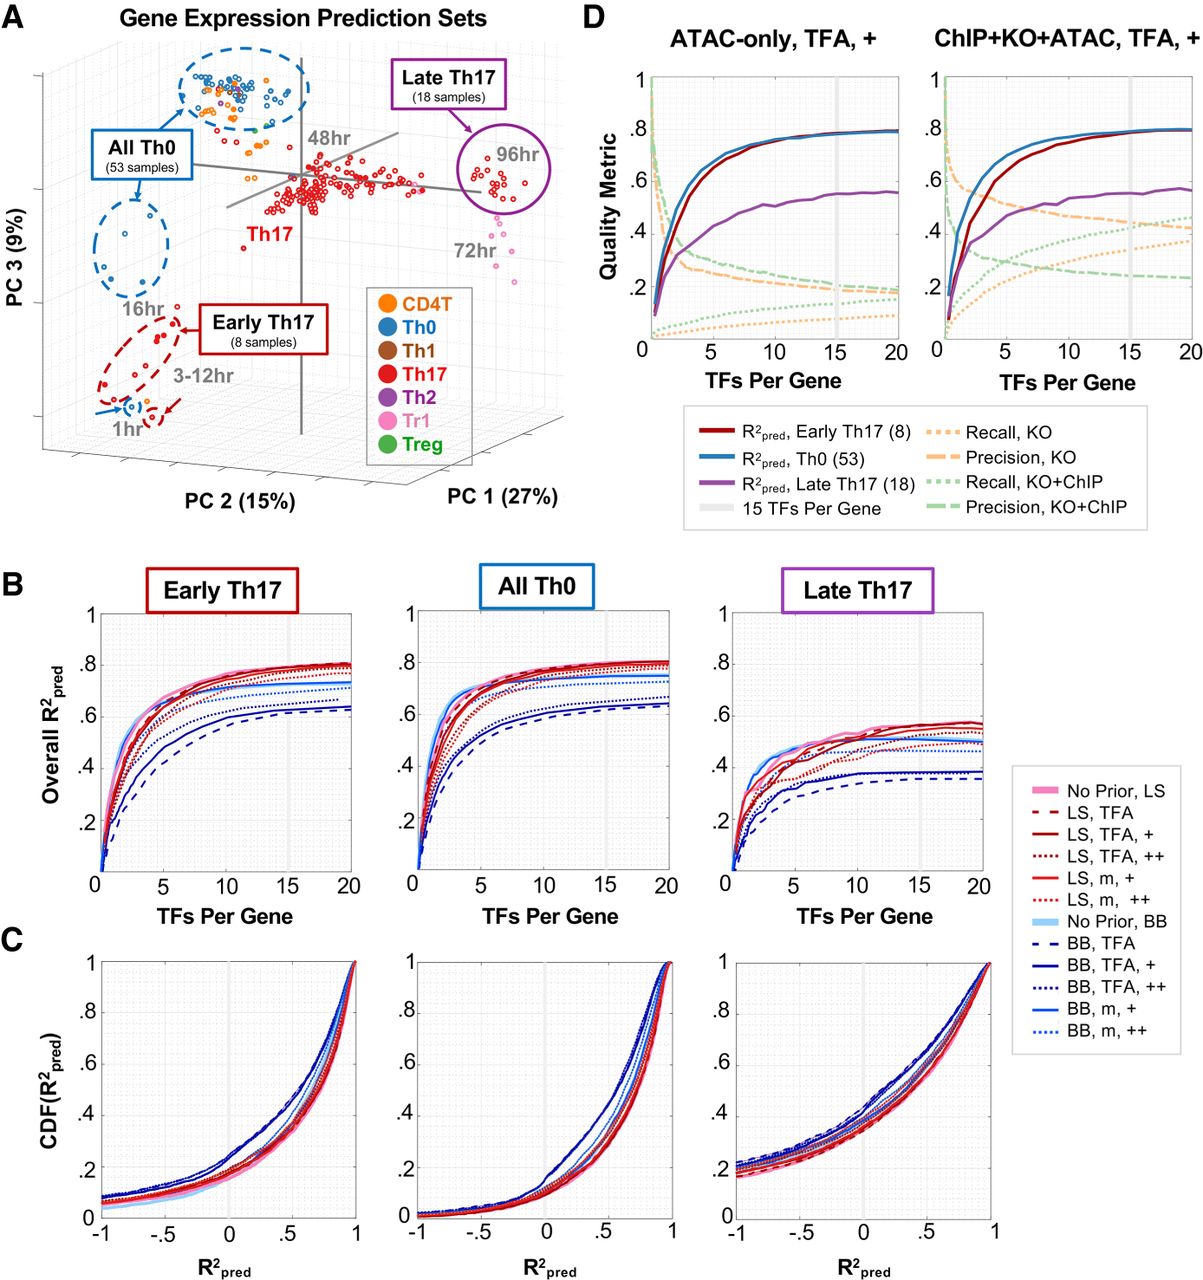
TRNs derived from RNA-seq and ATAC-seq data predict out-of-sample gene expression. (A) Leave-out sets plotted in PCA space. (B) Gene expression prediction. R2pred for each leave-out set is plotted as a function of mean number of TFs per gene. (LS) mLASSO-StARS; (BB) BBSR-BIC; (m) TF mRNA; (TFA) prior-based TFA; (+) indicates strength of prior reinforcement. The gray line corresponds to a model-size cutoff of mean 15 TFs per gene. (C) Distributions of R2pred values. Empirical cumulative distribution functions (CDFs) of per-gene R2pred values for each method (model-size cutoff = mean 15 TFs per gene). (D) Model quality metrics versus model size. For two TRN models built with Th17 ATAC (left) or ChIP + KO + ATAC (right) priors (mLASSO-StARS, bias = 0.5, TFA = P+X), the quality metrics (R2pred for each leave-out set, precision and recall) are plotted as a function of model size. The model size used for subsequent analyses is highlighted.


