
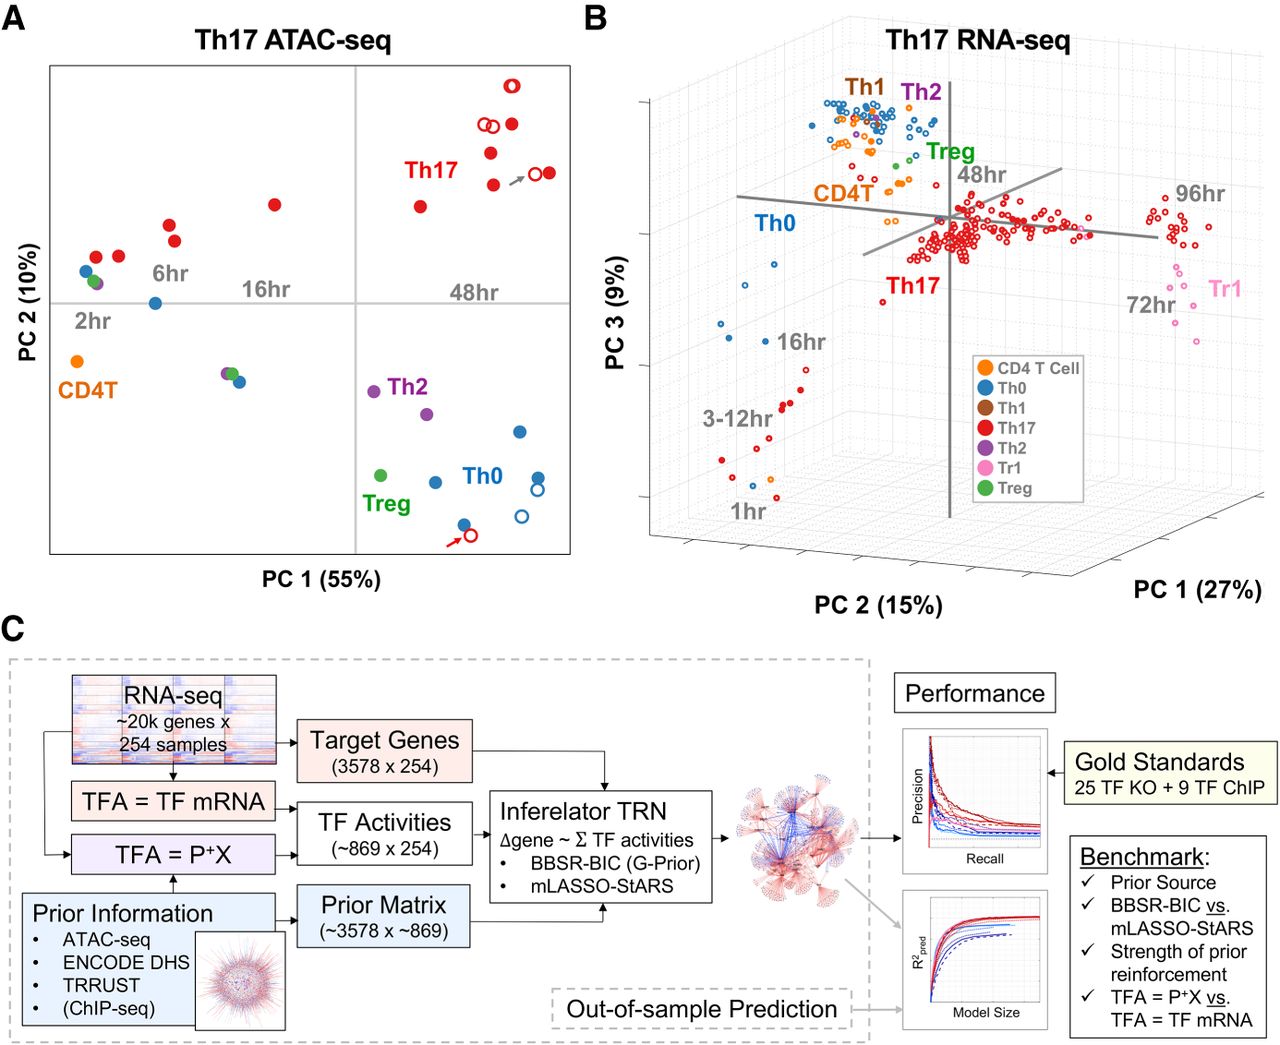
Figure 1.
New and existing genomic benchmark resources for TRN inference in Th17. (A) PCA of chromatin accessibility profiles. The 33 ATAC-seq samples are plotted as a function of ATAC-seq peak intensities in PCA space, using the reference set of 63,049 ATAC-seq peaks identified. Open circles denote experimental conditions that deviate from the standard T cell differentiation conditions (e.g., gene deletion, additional cytokines). Gray and red arrows indicate Maf and Stat3 KO Th17 conditions, respectively. (B) PCA of gene expression profiles. The 254 RNA-seq samples are plotted as a function of all genes in PCA space. (C) Study design (see text).


