
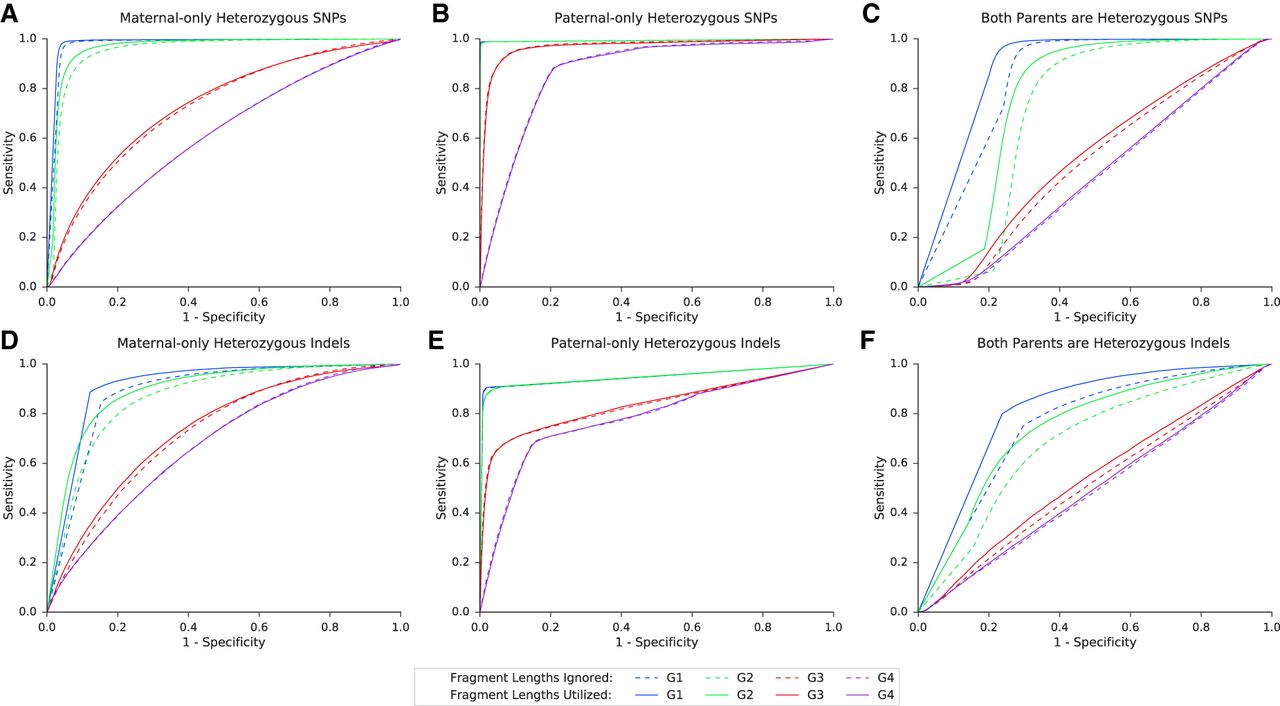
Figure 3.
Performance of the model over SNPs and indels in families G1–G4. Presented in the ROC curves are results for families G1–G4, in three categories of either SNPs (A–C) or indels (D–F), as described. In positions where only one parent was heterozygous, we examined whether the shared allele was transmitted to the fetus (based on the true fetal genotype). If both parents were heterozygous, we examined whether the true fetal genotype was heterozygous or homozygous. The corresponding AUC and accuracy values are shown in Table 2.


