
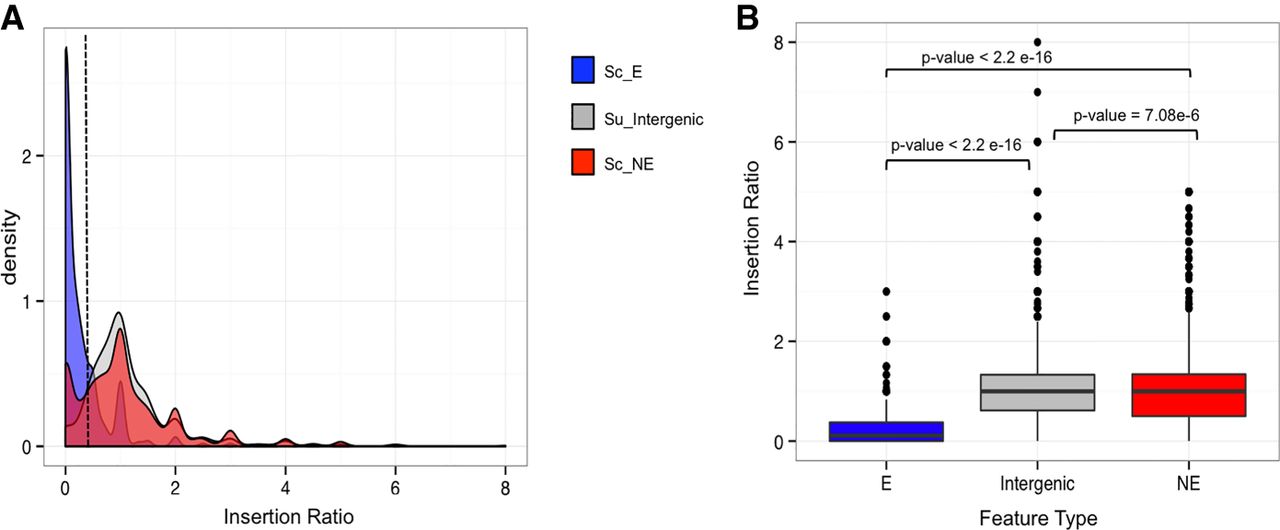
Insertion ratio distributions of S. uvarum intergenic regions and known S. cerevisiae essential and nonessential genes. (A) Density plots displaying the distribution of insertion ratios across three feature types: S. uvarum intergenic regions between Watson-and-Crick–oriented genes ranging from 7 kb–500 bp (gray) and S. uvarum genes whose orthologs are known S. cerevisiae essential (Sc_E in blue) and nonessential genes (Sc_NE in red). The dashed line represents an insertion ratio of 0.25 and defines the cut-off value to classify essential and nonessential genes. (B) Box plots of insertion ratios by feature type described in plot A. Significant insertion ratio differences exist between known S. cerevisiae essential and nonessential genes and between S. uvarum intergenic regions. (Wilcoxon tests Sc_E:Su_Intergenic P < 2.2 × 10⁻¹⁶, Sc_E:Sc_NE P < 2.2 × 10⁻¹⁶, Sc_NE:Su_Intergenic P = 7.08 × 10⁻⁶).


