
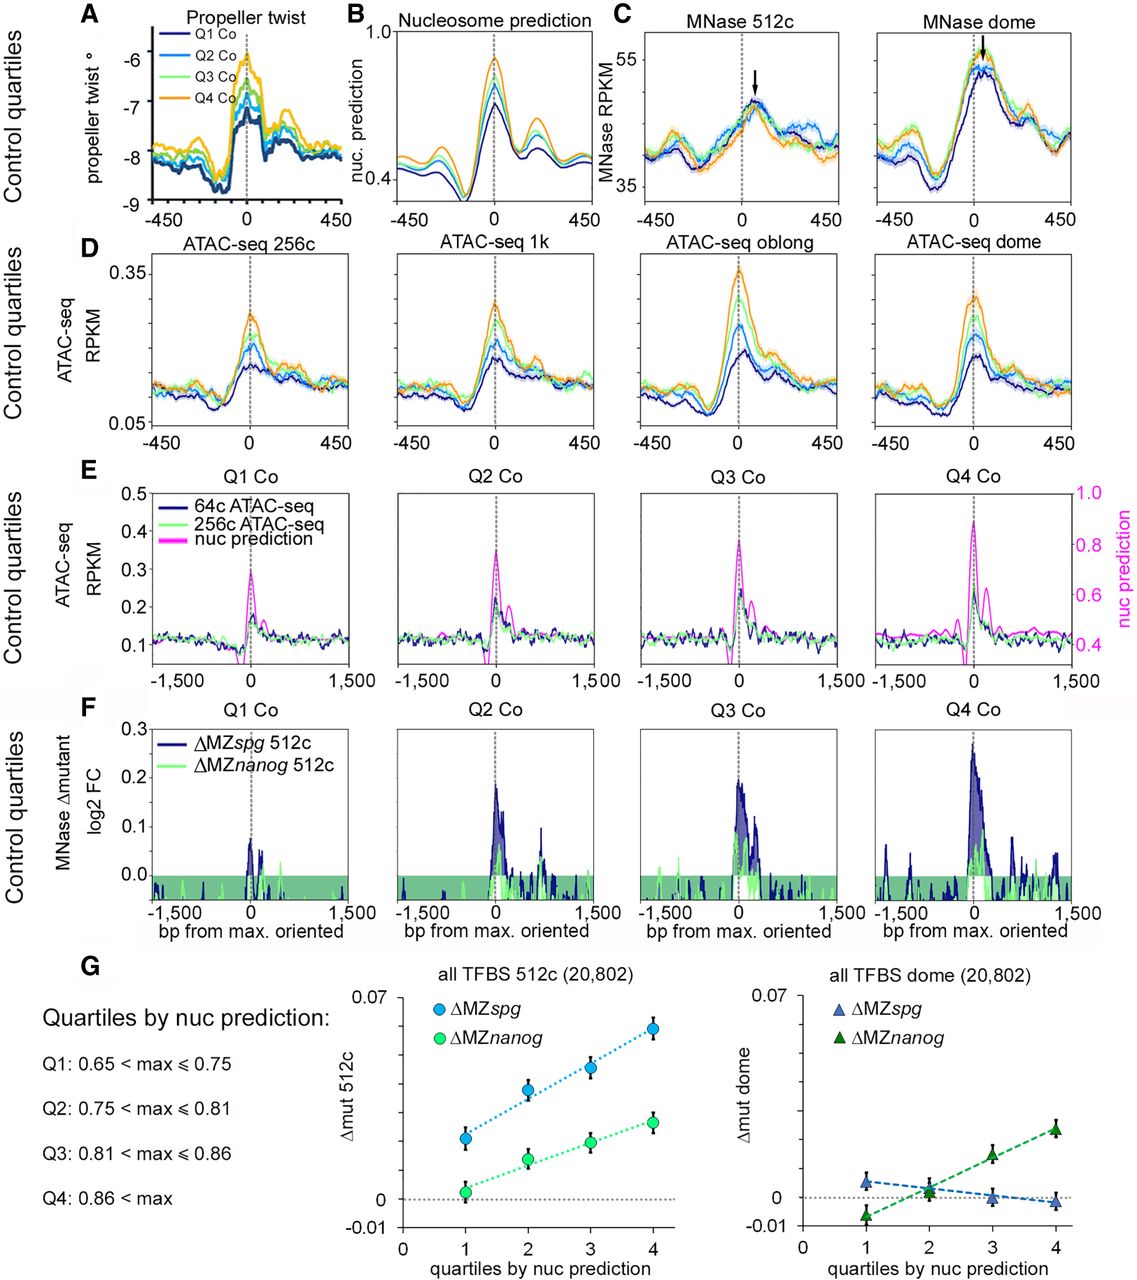
Pou5f3 and Nanog randomly displace nucleosomes from HNAR centers pre-ZGA. (A–D) Random control genomic regions were ranked by ascending nucleosome prediction score into quartiles Q1 through Q4, aligned at HNAR centers ([nucmax]; gray dotted lines), and oriented as in Figure 3H. (A) Propeller twist (PT°); (B) nucleosome prediction; (C) MNase-seq (black arrows show the lateral shift from [nucmax]); and (D,E) ATAC-seq signal colocalizes with [nucmax] and increases with nucleosome prediction value. (F) Random control quartiles: Nucleosome displacement from HNAR centers by Pou5f3 and Nanog at the 512-cell stage increases with nucleosome prediction value. Gray dotted lines indicate [nucmax]. (G) Dependencies of Δmut (nucleosome occupancy) from nucleosome prediction strength in the whole TFBS data set: (left) 512-cell stage; (right) dome.


