
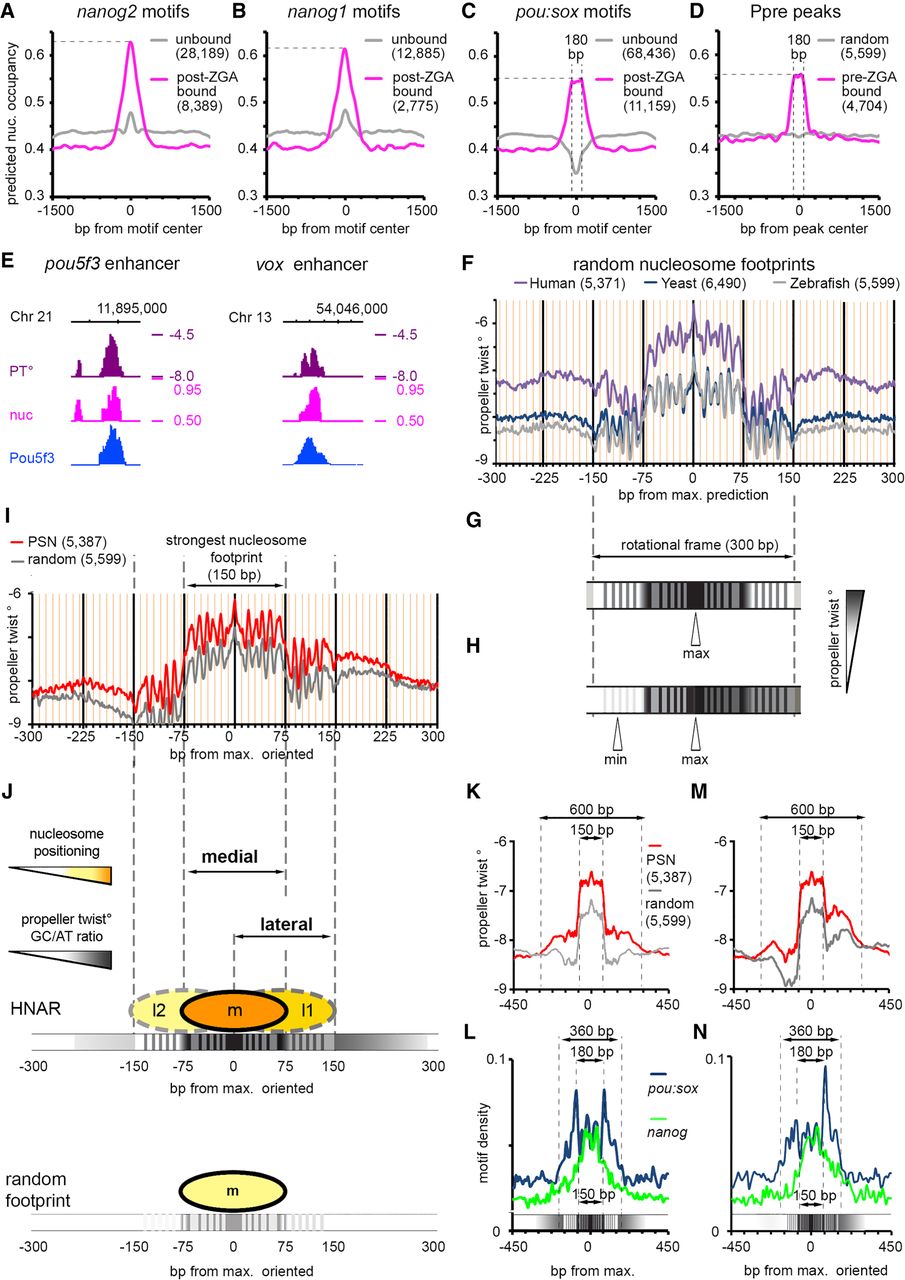
Pou5f3, SoxB1, and Nanog bind to the high nucleosome affinity regions (HNARs). (A–C) Mean predicted nucleosome occupancy plots on the indicated motifs bound by respective TF (magenta) versus unbound random motif matches (gray). (D) Mean predicted nucleosome occupancy plot centered on Pou5f3 pre-MBT TF binding peaks (magenta) versus random sequences (gray). (E) Pou5f3 binds to the regions of high predicted nucleosome occupancy and propeller twist on the enhancers of pou5f3 and vox. (PT°) Propeller twist; (nuc) in vitro nucleosome occupancy prediction, tick marks every 1 kb. (F) Propeller twist summary plot of random zebrafish, yeast, and human genomic regions aligned at the base pair with maximal predicted nucleosome occupancy within 320 bp [nucmax]. Yellow x-axis gridlines 10 bp apart. (G) Scheme of the PT periodic oscillations in 300 bp around [nucmax]. (H) Scheme of the oriented PT plot aligned at [nucmax]. (I) Oriented PT plot of PSN group (red) and control genomic regions (gray). (J) Scheme of medial and lateral strong nucleosome footprints at HNAR. Central 300-bp periodic frame supports alternative medial, lateral one, and lateral two nucleosome positions with decreasing strength (m > l1 > l2 = random footprint); in random sequence, only medial footprint is supported (bottom). (K,M) Symmetric (K) and oriented (M) smoothened PT plots (80-bp moving average) of PSN and control genomic regions, aligned at [nucmax]. (L,N) Distribution of nanog and pou:sox motifs in the PSN group for K and M, respectively. Motif density in base-pair motif per base-pair sequence.


