
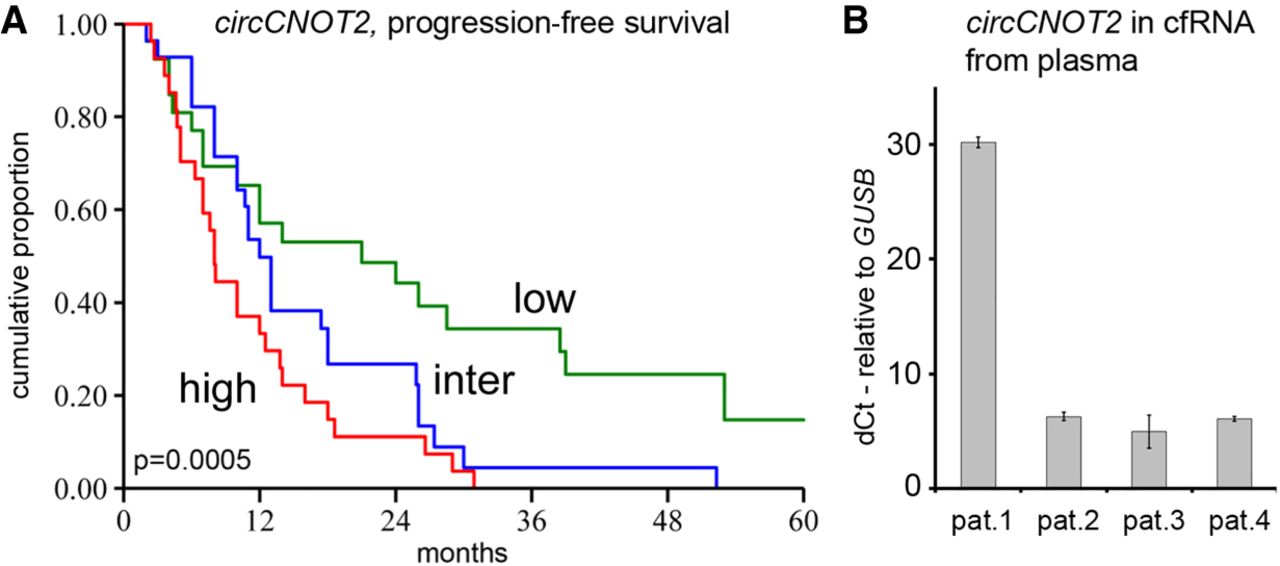
Figure 7.
Clinical evaluation and presence in plasma samples. (A) Kaplan–Meier survival curve of progression-free survival for AI therapy in which patients were grouped in three equally sized groups based on their circCNOT2 expression: red, blue, and green indicate the samples with high, intermediate, and low expression. The x-axis is in months; y-axis depicts the cumulative probability of progression-free survival on AI therapy. The P-value is the log-rank test for trend. (B) Expression levels of circCNOT2 in plasma samples. Four metastatic breast cancer patients were evaluated. The y-axis depicts delta-Ct values of circCNOT2 relative to GUSB. Error bars, SD of two measurements.


