
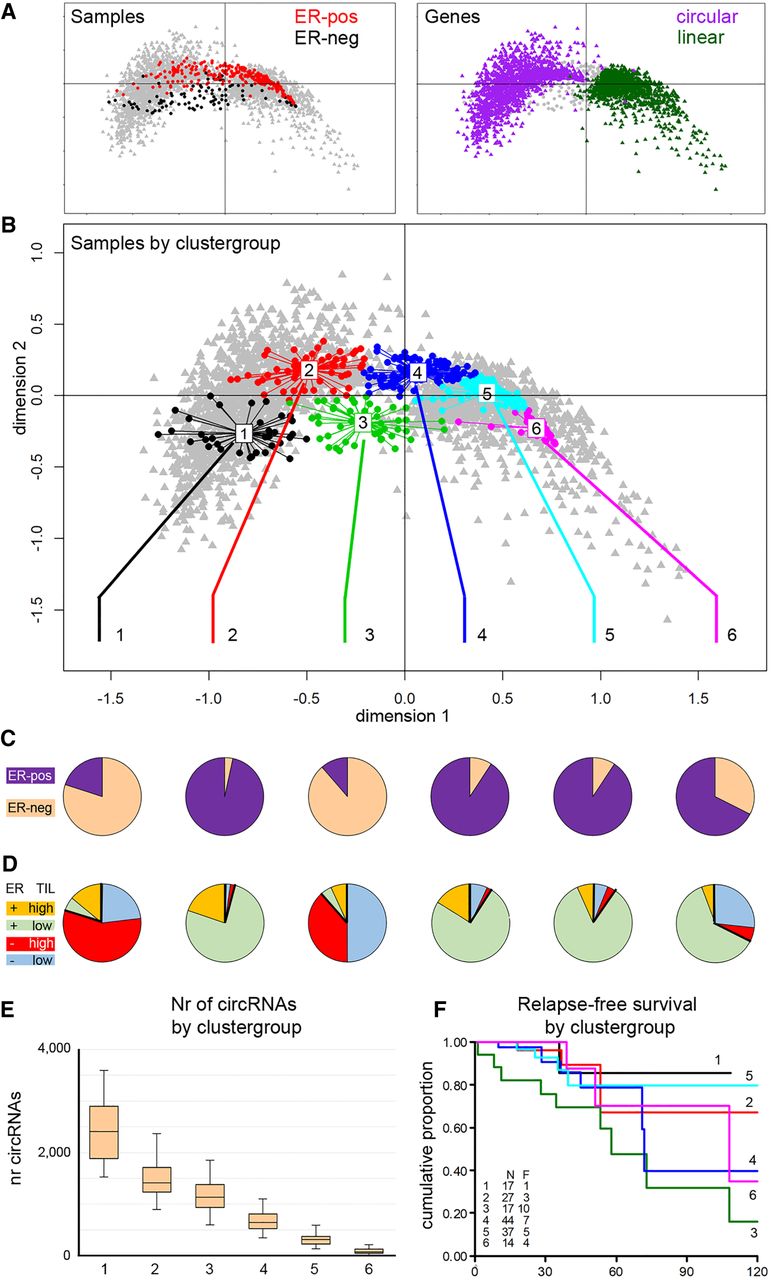
Analysis of sample groups according to circRNA presence. Multiple correspondence analysis (MCA) was used to find naturally occurring groups in the circRNA data. In an MCA plot, samples and circRNAs are projected onto the same plane, in which the relative distance to either the samples or the circRNAs is meaningful. The 0,0 point corresponds to a sample or circRNA with an average profile. (A, left) Samples are colored according to ER status: red, ER-positive; black, ER-negative. (Right) Purple and green indicate genes with or without circRNA expression, respectively. (B) Clustering identified samples with similar circRNA profiles; samples in the MCA plot are colored according to the cluster to which the sample belongs. (C) ER status (purple, ER-positive; peach, ER-negative) and (D) TIL status of the six sample groups: Red and orange are high-TIL cases and blue and green are low-TIL cases for ER-negative and ER-positive, respectively. (E) Number of circRNAs per sample group. (F) Relapse-free survival plot by sample group. (N) number of patients; (F) number of patients who relapse; (x-axis) months; (y-axis) the cumulative probability of relapse-free survival.


