
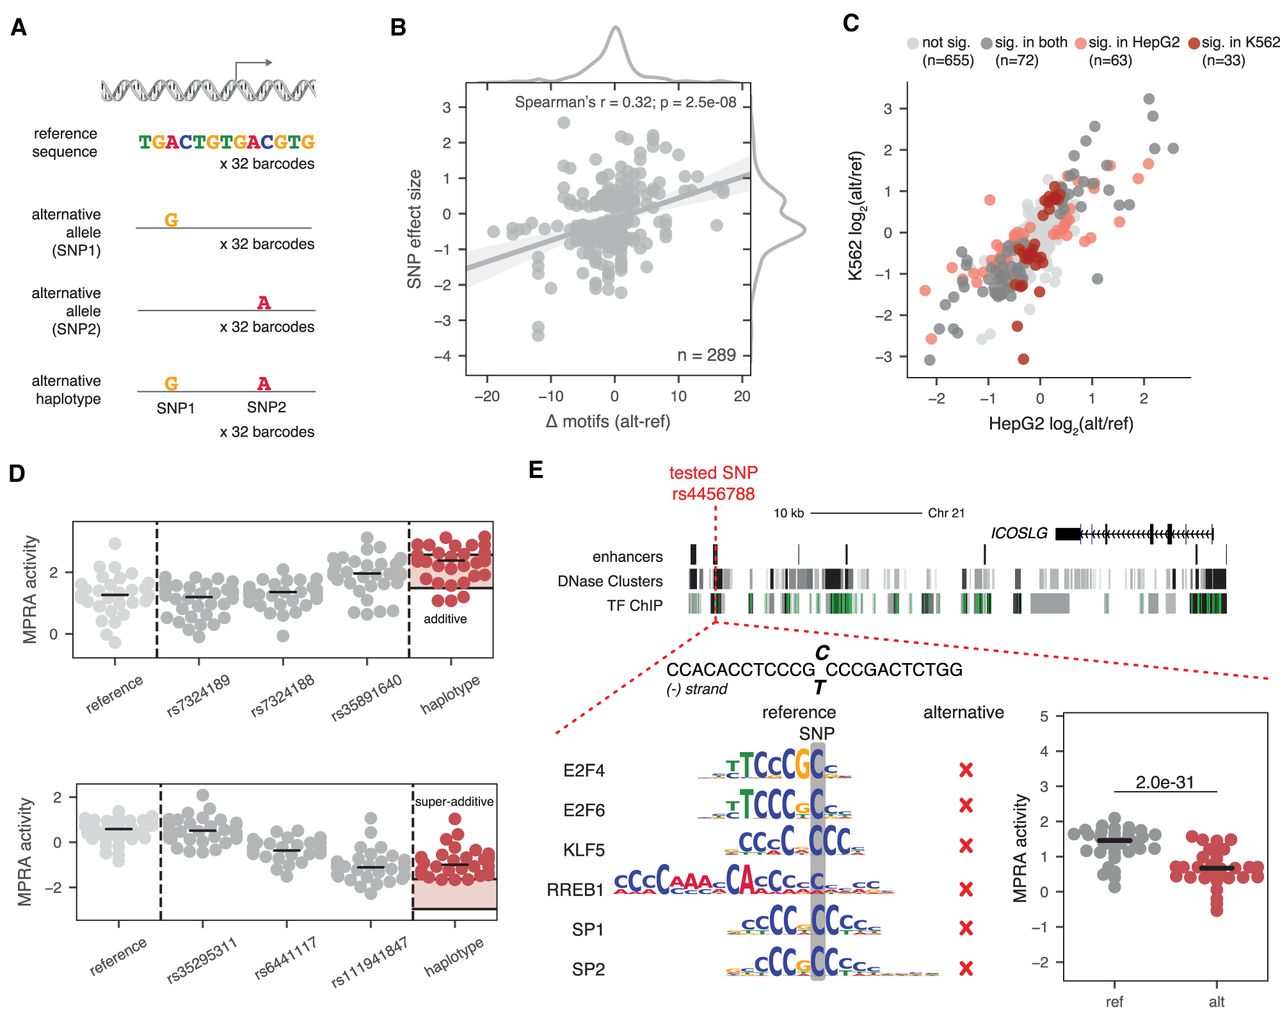
Twenty-two percent of SNPs in promoter and enhancer TSSs have regulatory effects. (A) Schematic of SNP and haplotype testing in MPRA. (B) Correlation between the number of TF motifs disrupted (x-axis) and the SNP effect size (y-axis) for all significant SNPs in HepG2. SNP effect size is the mean log2 fold change in MPRA activity between the alternative and reference alleles. (C) Correlation between SNP effect sizes in HepG2 (x-axis) and K562 (y-axis). (D) Examples of two haplotype effects, one additive (top) and one super additive (bottom). Dots represent barcode activity means across replicates for reference tile (light gray), individual SNP tiles (dark gray), or haplotype tiles (red). Shaded red area in the haplotype column refers to the 90% confidence interval surrounding the expected median additive effect. (E) Example of a SNP near ICOSLG that disrupts six TF motifs present on the reference allele. The difference in MPRA activity between the reference and alternative alleles in HepG2 is shown. P-value listed is from a two-sided Wilcoxon test.


