
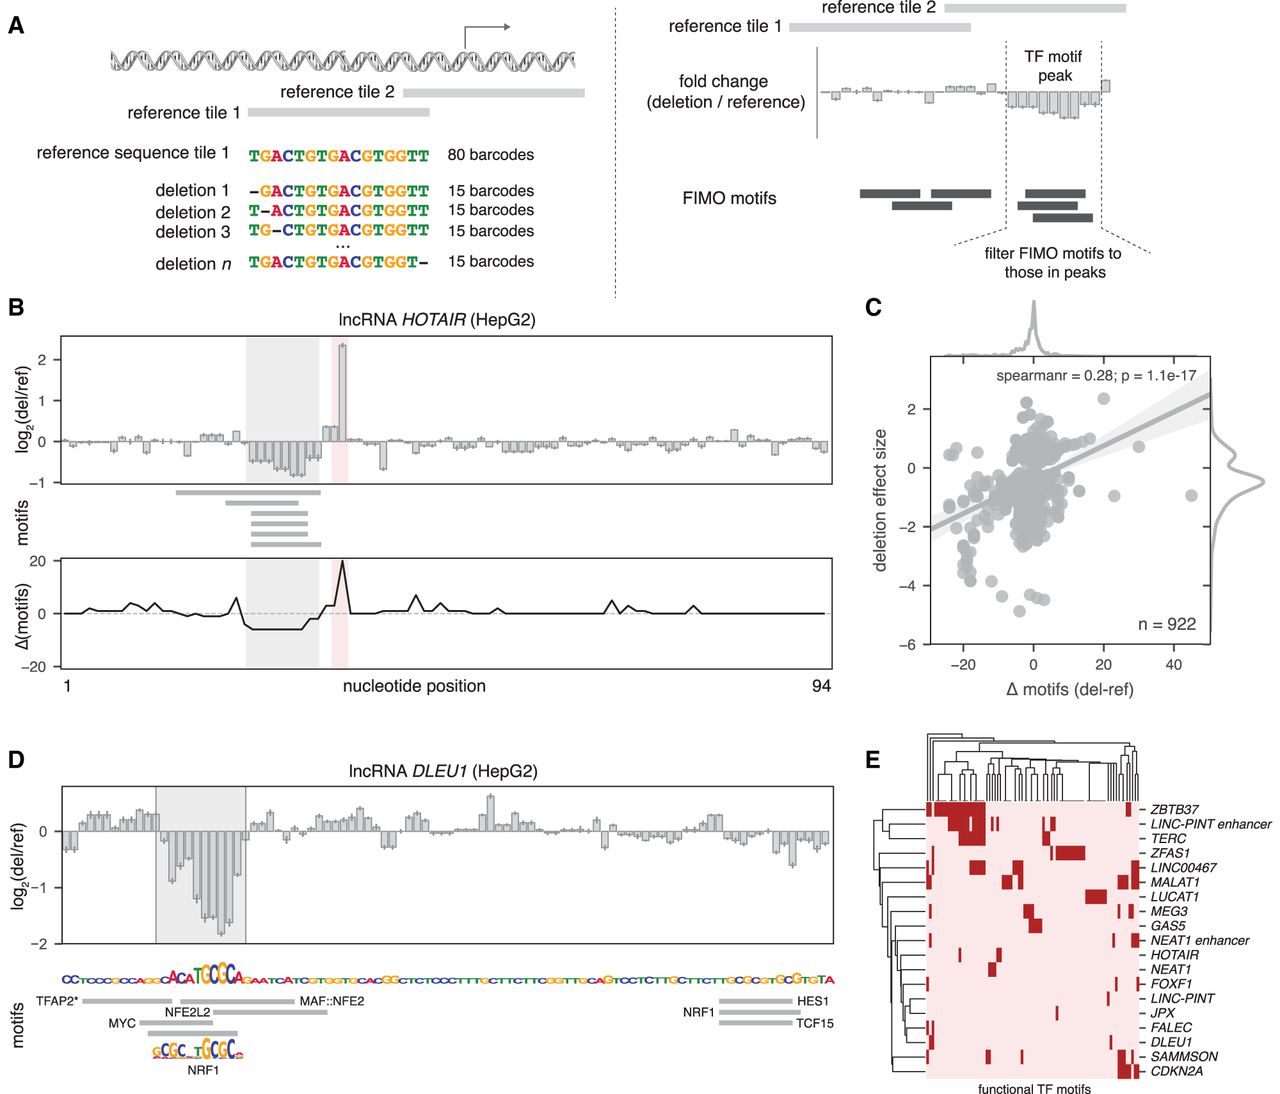
Targeted deletions refine TF motifs within lncRNA promoters. (A) Schematic of the single-nucleotide deletion MPRA design (left) and the output interpretation (right). (B) MPRA deletion profile for the lncRNA HOTAIR promoter (top), the positions of computationally mapped motifs in the reference sequence (middle), and the number of motifs predicted to be gained or lost due to the single-nucleotide deletions (bottom). Shaded areas represent the strongest gain (red) or loss (gray) of activity. (C) Correlation between the number of motifs predicted to be disrupted (x-axis) and the effect size of deletions (y-axis) for all significant deletions in HepG2. (D, top) MPRA deletion profile for the lncRNA DLEU1 promoter. Shaded area is a called peak. (Bottom) DLEU1 sequence (plotted with letter heights proportional to loss of activity in the MPRA) and computationally mapped motifs (gray boxes). The sequence logo for NRF1 is shown. (*) TFAP2A, TFAP2B, and TFAP2C all map to the noted gray box. (E) Heatmap showing all computationally mapped motifs that overlap deletion peaks in HepG2.


