
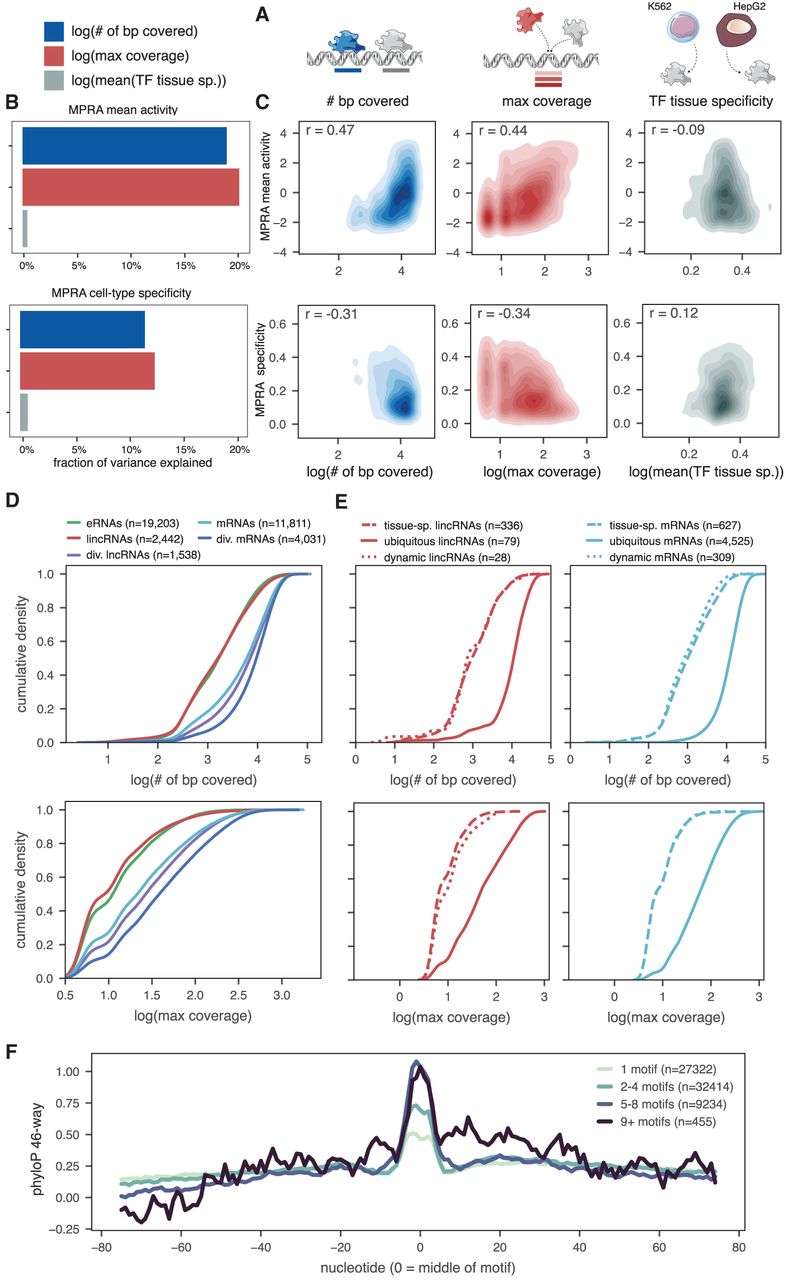
Coverage of TFs within a binding site explains expression levels and cell-type–specificity variability. (A) Schematic of the three metrics used to model the capacity to drive transcription and cell-type specificity in the MPRA. For each metric, only TF motifs that have been validated by ChIP (i.e., overlap a ChIP peak for the cognate TF) are considered. (B) Fraction of variance explained by each of the three metrics for either mean MPRA activity (top) or MPRA cell-type specificity (bottom). (C) Correlation between the three metrics (x-axis) and either the mean MPRA activity (top) or MPRA cell-type specificity (bottom) across HeLa, HepG2, and K562. Spearman's ρ is shown. (D) Cumulative density plot of the number of base pairs covered by a motif across all biotypes (top) and the maximum motif coverage across all biotypes (bottom). (E) Cumulative density plot for number of base pairs covered (top) and maximum motif coverage (bottom) either within lincRNAs (left) or within mRNAs (right), looking only at TSSs that are defined as tissue-specific (tissue-sp.), ubiquitous, or dynamically expressed (see text). (F) Metaplot of the average phyloP 46-way placental mammal conservation score centered on motif regions, broken up by how many individual TF motifs map to the region. In all plots, only sequences with at least one validated motif were considered.


