
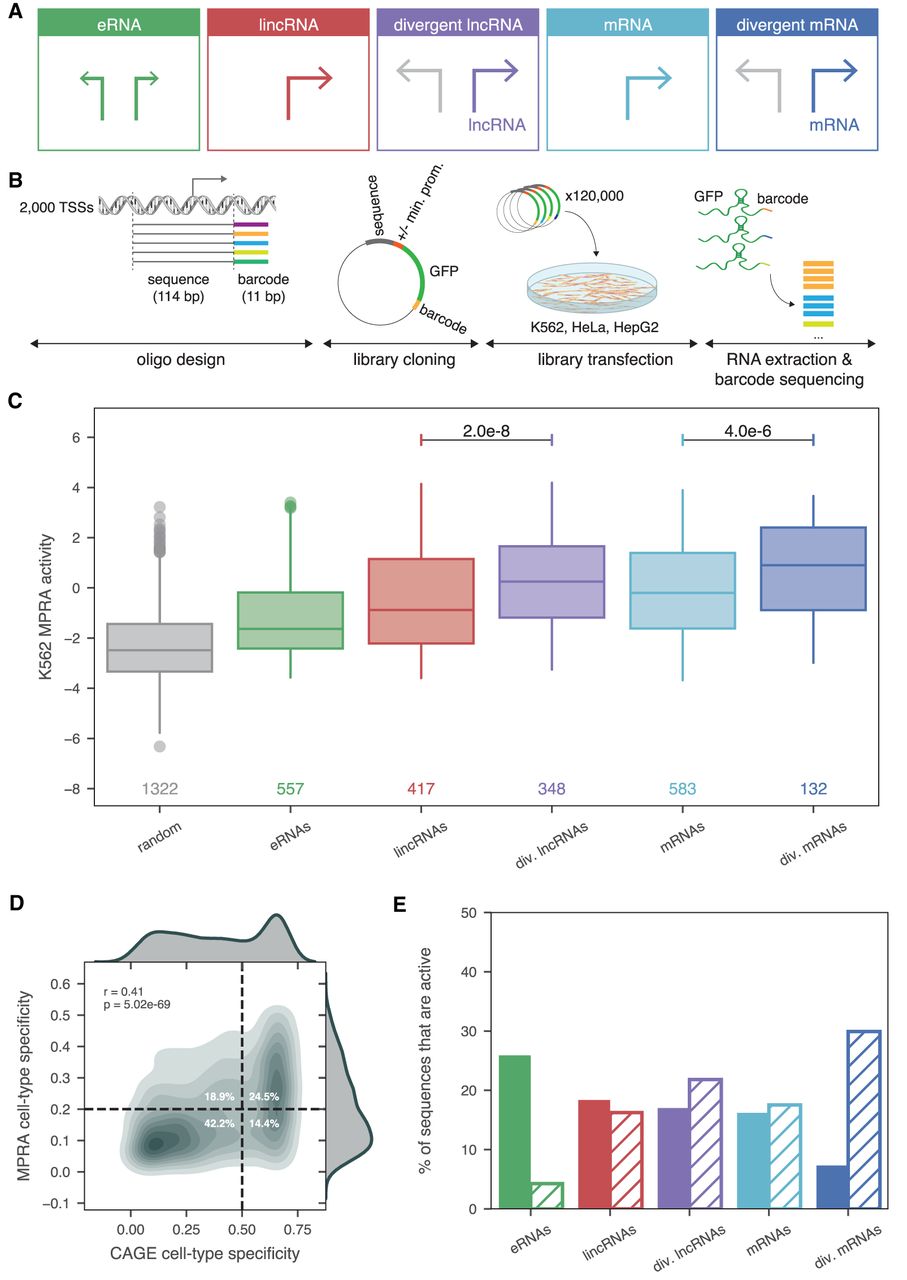
Core promoter sequences of different TSS classes vary in strength and cell-type specificity. (A) Overview of TSS classification based on element class (lncRNA, mRNA, or eRNA) and presence or absence of a divergent stable transcript arising from the same promoter region on the antisense strand. (B) Schematic of MPRA experimental design. (Min. prom.) Minimal promoter. (C) Comparison of MPRA activities (fold change between normalized RNA barcodes and input DNA barcodes) of the reference sequences of each TSS class to negative control sequences in K562 cells. Only TSSs that meet the quality criteria of three or more barcodes represented each with five or more DNA and RNA counts are plotted and n values are shown. P-values listed are from a two-sided Wilcoxon test. (D) Correlation between CAGE cell-type specificity calculated across HeLa, HepG2, and K562 (x-axis) and MPRA cell-type specificity across the same three cell lines (y-axis). The upper right and lower left quadrants correspond to sequences that agree with CAGE and MPRA and make up 67% of sequences. Dashed horizontal and vertical line thresholds for specificity were determined from the distribution of specificity values, shown as density plots on the top and to the right of the main plot. Spearman's ρ and P-value are shown. (E) Percent of sequences that are active in only one cell type (solid bars) or all three cell types (K562, HepG2, and HeLa; hatched bars) within each biotype.


