
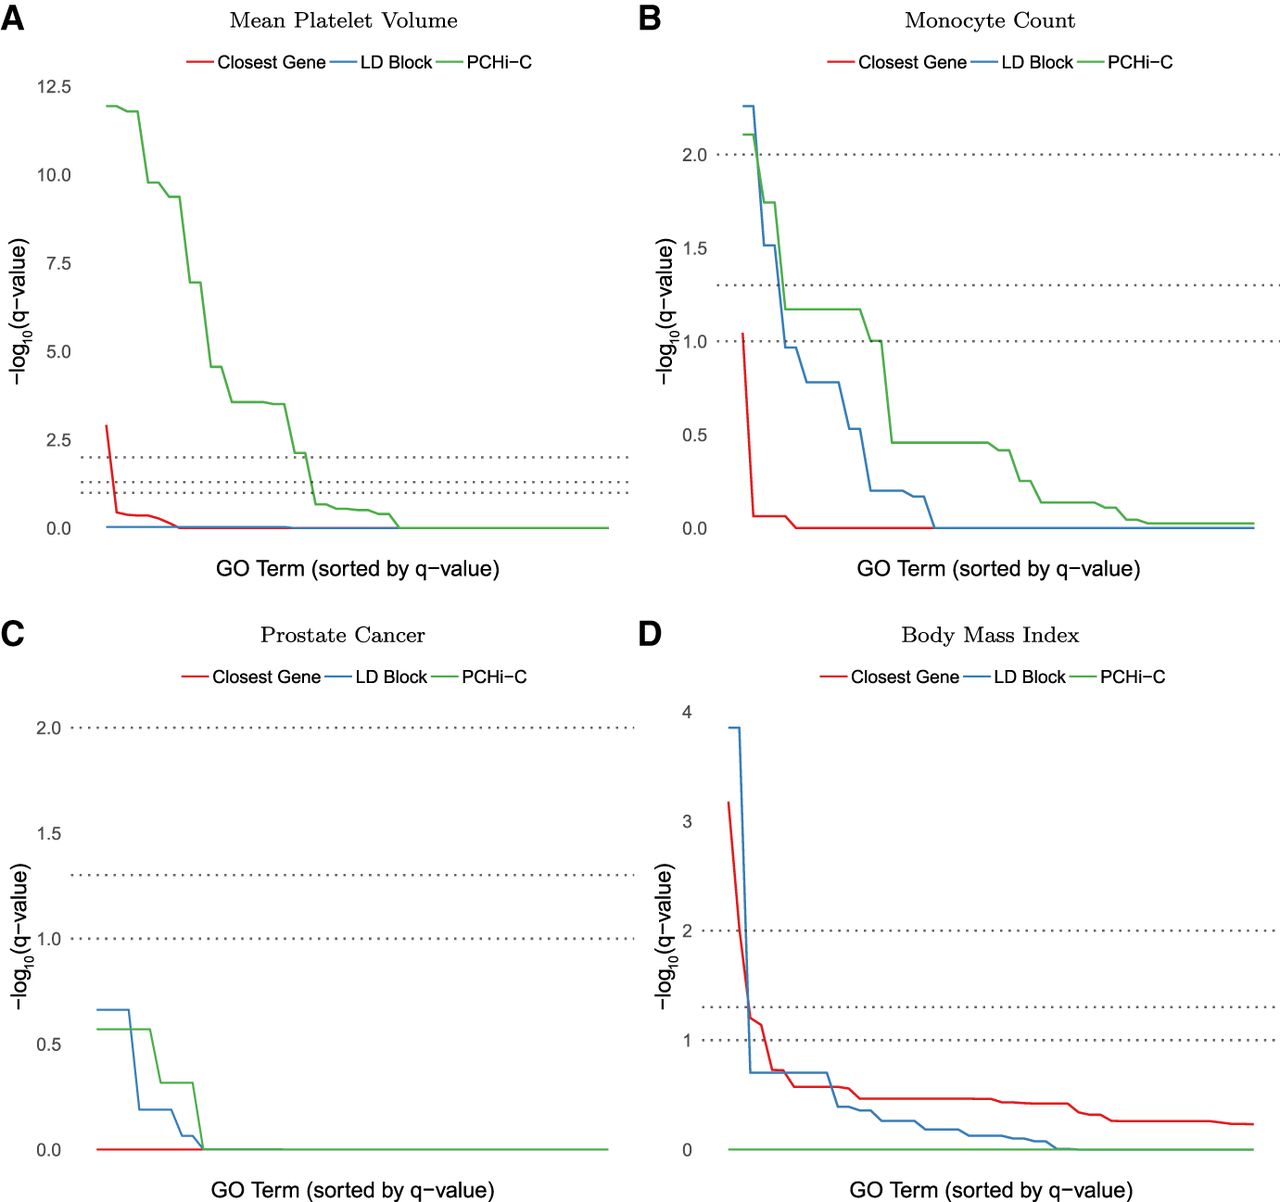
Enrichment of GO terms (Benjamini-Hochberg–adjusted P-values, −log10 scale) in multiple phenotypes from the GWAS catalog (MacArthur et al. 2017). Methods for functional assignment of SNPs include using the closest gene, all genes within the same LD block (EUR super-population), and promoter capture bait genes with a SNP located in the promoter-interacting region of a statistically significant blood cell chromatin interaction (Javierre et al. 2016). Gray horizontal lines indicate false discovery rate (FDR) cutoffs of 1%, 5%, and 10%. (A,B) In blood-relevant phenotypes, PCHi-C bait genes interacting in 3D with GWAS SNPs typically show more enrichment for a larger number of terms than same-LD-block or closest gene approaches, whose enrichment is affected by large numbers of false positives and negatives. (C,D) For non-blood phenotypes, chromatin interactions in the wrong cell type can have little or no enrichment. Statistically significant enrichments are occasionally detected with the closest gene and same-LD-block approaches, perhaps reflecting the cell-type specificity of PCHi-C over these approaches.


