
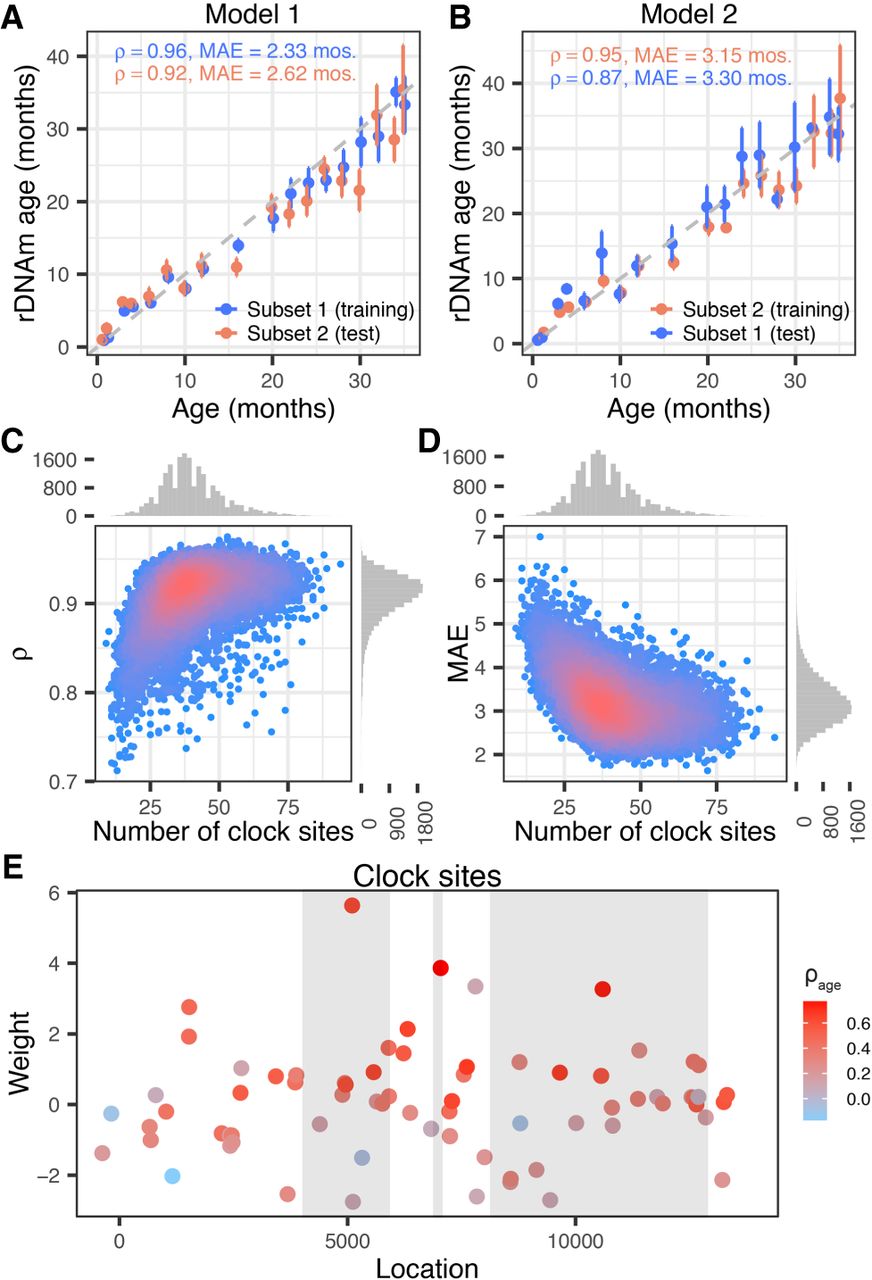
Building the rDNAm age clock. (A,B) Example of two rDNA methylation clock models: (A) Model 1; (B) Model 2. Note that the training and testing subsets are reversed in the two models. (C,D) Performance of 20,000 models trained and tested on randomly split subsets of the mice data set. (C) Correlation coefficients (ρ) between the predicted age (i.e., rDNAm age) and chronological age of the test subsets were plotted against the number of clock CpGs of each model. (D) The median absolute errors (MAEs) of the rDNAm ages were plotted against the number of clock CpGs of each model. (E) Location and weights of the 72 clock sites identified by the best-fitted model. The three gray blocks represent the 18S, 5.8S, and 28S components (from left to right). The color coding represents the strength of age association in each site.


