
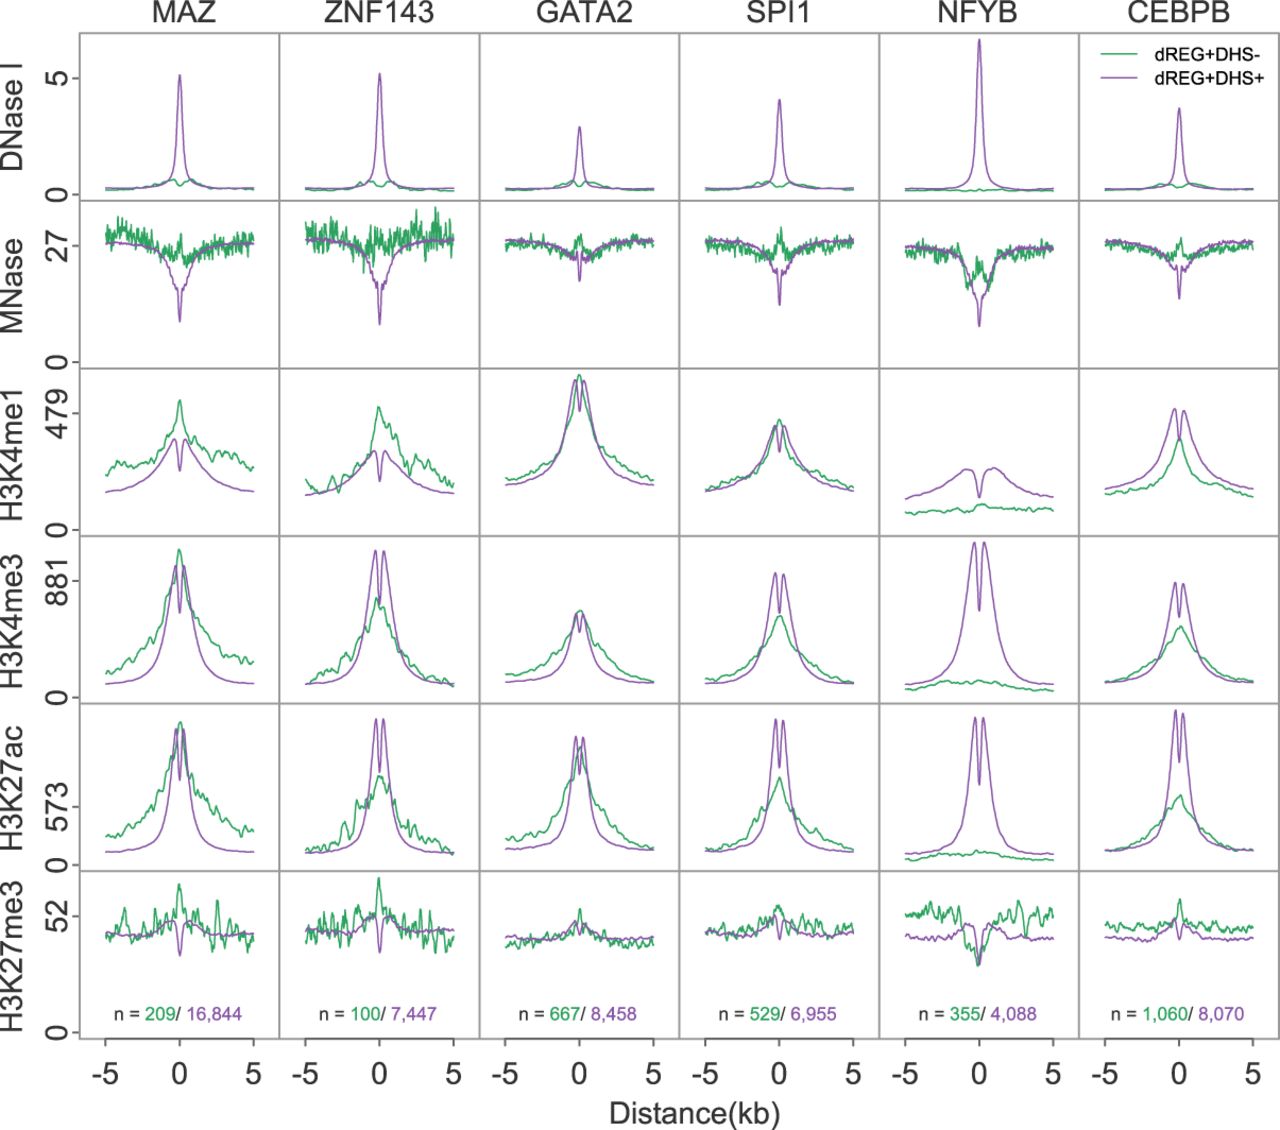
Figure 5.
dREG TIRs with specific transcription factor binding show distinct chromatin marks. Metaplots show the raw signal of DNase-seq, MNase-seq, and ChIP-seq for H3K4me1, H3K4me3, H3K27ac, and H3K27me3 near binding sites for six transcription factors, including MAZ, ZNF143, GATA2, SPI1, NFYB, and CEBPB. Signals are shown for dREG+DHS− (green) and dREG+DHS+ (purple) sites. The number of sites contributing to each signal is shown (bottom).


