
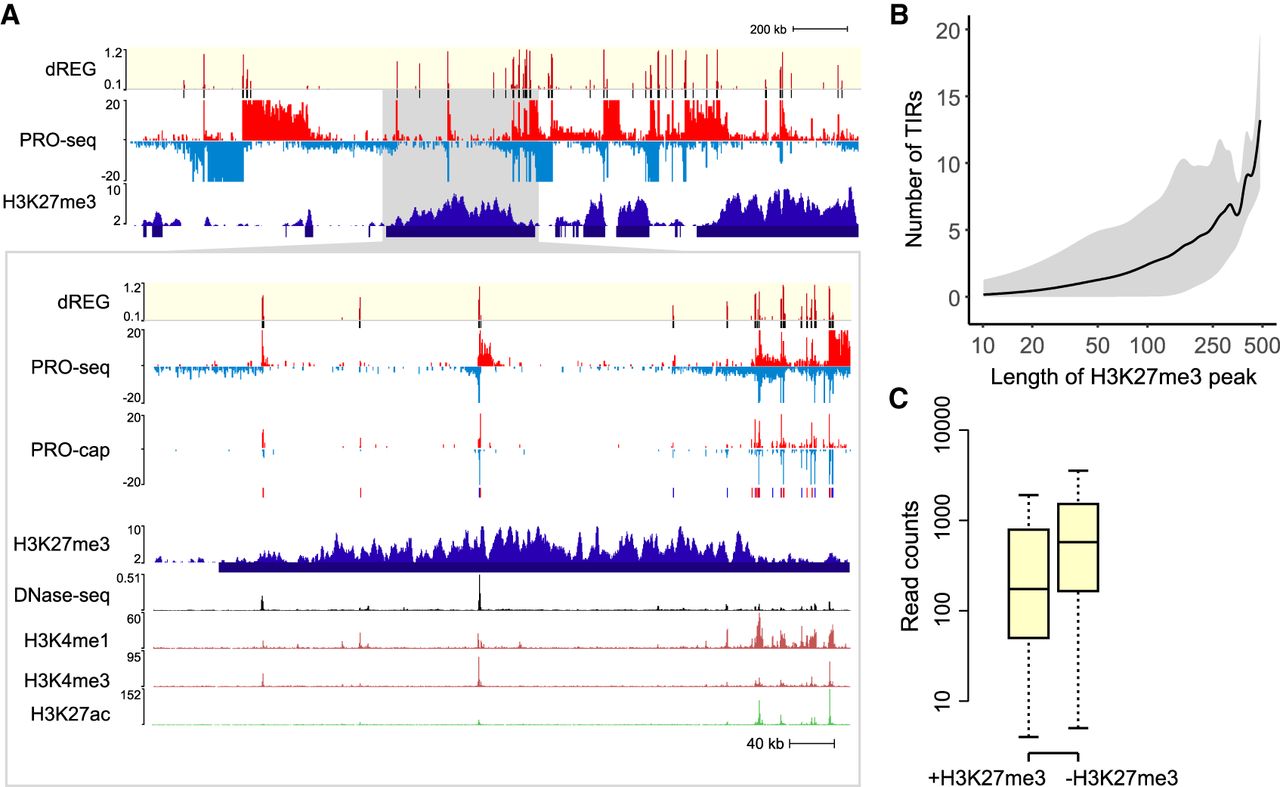
dREG TIRs located in H3K27me3 domains. (A) WashU Epigenome Browser visualization of dREG signal, PRO-seq data, GRO-cap, H3K27me3 ChIP-seq, DNase-seq, and H3K4me1, H3K4me3, and H3K27ac ChIP-seq. The insert (cf. gray shaded pointer) shows an expanded view of the H3K27me3 domain encoding multiple transcription initiation sites that were also supported in GRO-cap data. (B) The number of TIRs discovered in each H3K27me3 broad peak as a function of H3K27me3 peak size. The line represents the median, and gray shading denotes the fifth and 95th percentile. The x-axis is a log scale. (C) The box plot shows the difference in PRO-seq read counts between TIRs in an H3K27me3 peak call (+H3K27me3, left) and outside of an H3K27me3 peak call (−H3K27me3, right). The y-axis represents the number of reads found within 250 bp of each TIR.


