
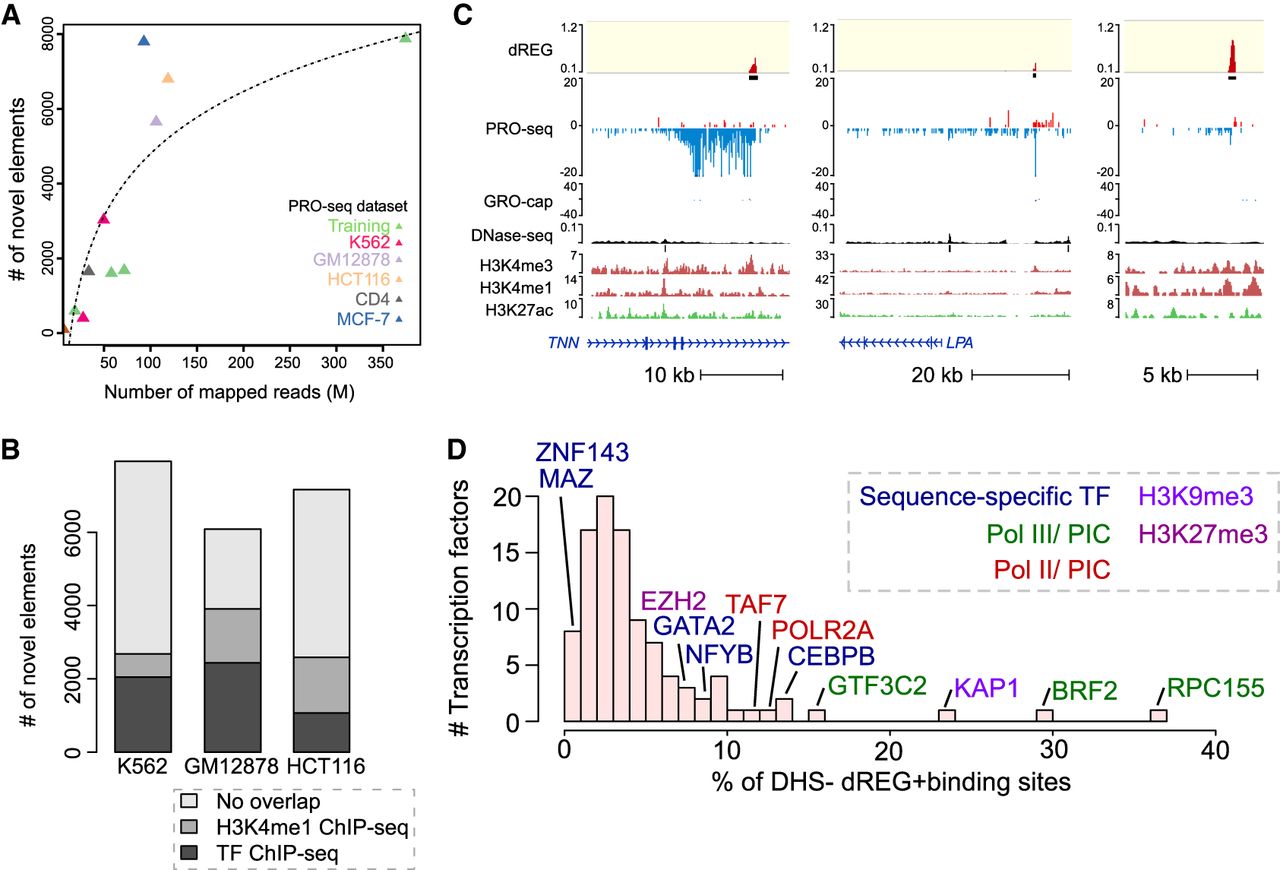
dREG identifies new regions that were not found using other molecular assays. (A) Scatterplot shows the number of new TIRs that were not discovered in DNase-seq or H3K27ac ChIP-seq data (y-axis) as a function of sequencing depth (x-axis) for seven data sets shown in Supplemental Table S1. The best fit line is shown. The color represents whether the data set was used for training (green) or is a holdout data set (K562, red) or cell type (GM12878, lavender; HCT116, orange; CD4+ T-cells, gray; MCF-7, blue). (B) Stacked bar charts show the number of elements discovered using dREG, but not found in DNase-seq or H3K27ac ChIP-seq (y-axis) for PRO-seq or GRO-seq data sets in K562, GM12878, and HCT116 cells. The color denotes other functional marks intersecting sites discovered only using dREG. (C) Three separate genome browser regions that denote TIRs discovered using dREG, but were not found in DNase-seq or H3K27ac ChIP-seq data. Tracks show dREG signal, PRO-seq data, GRO-cap, DNase-seq, H3K27ac ChIP-seq, and annotated genes. (D) Histogram representing the fraction of binding sites for 100 transcription factors supported by a dREG TIR that was not also discovered in DNase-seq data. Several of the outliers are shown. The color denotes whether the factor is a member of the RNA polymerase III (Pol III) preinitiation complex (green), Pol II preinitiation complex (red), associated with H3K9me3 (light purple), or H3K27me3 heterochromatin (purple), or is a sequence-specific transcription factor (blue).


