
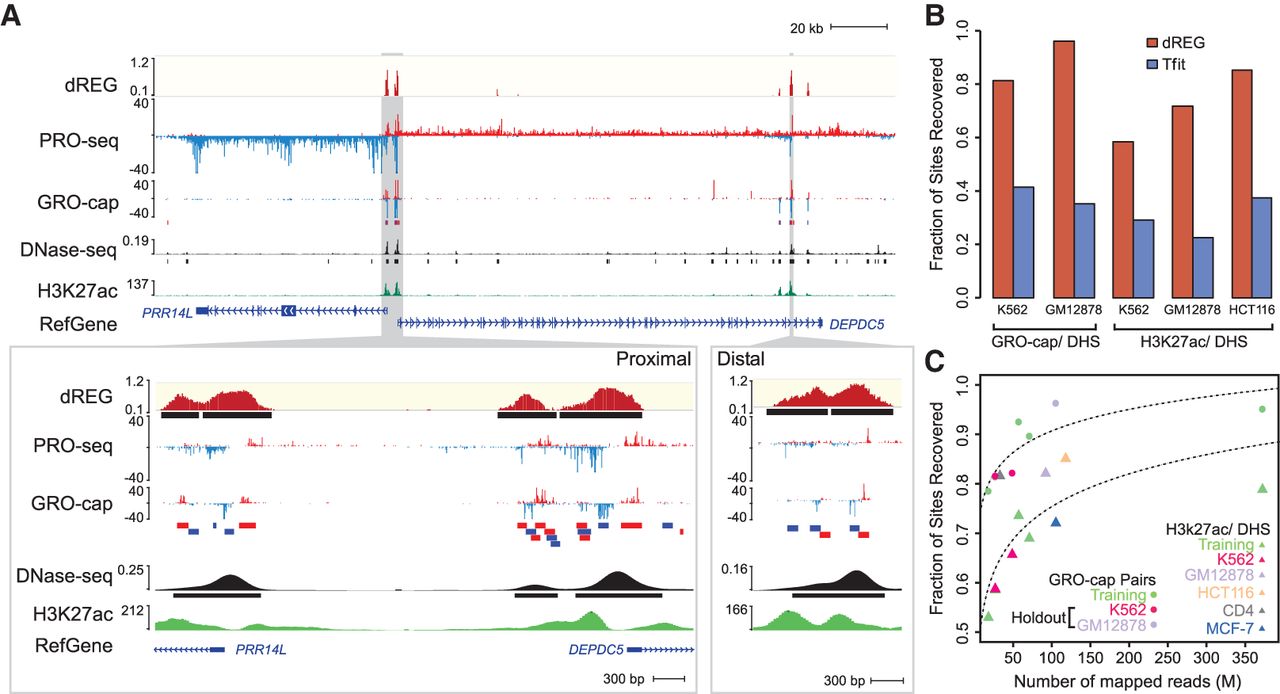
dREG identifies regions of transcription initiation. (A) WashU Epigenome Browser visualization of dREG signal, PRO-seq data, GRO-cap, DNase-seq, and H3K27ac ChIP-seq near the PRR14L and DEPDC5 genes. Inserts (cf. gray shaded pointers) show an expanded view of gene-proximal promoter elements (left) and a distal enhancer (right), each encoding multiple transcription initiation sites. (B) Bar plots show the fraction of transcribed DHSs (left) and H3K27ac+ DHSs (right) that were discovered by dREG (red) and Tfit (blue) in holdout data sets. (C) Scatterplot shows the fraction of sites recovered (y-axis) as a function of sequencing depth (x-axis) for 12 data sets shown in Supplemental Table S1. The best fit lines are shown. The color represents whether the data set was used for training (green) or is a holdout data set (K562, red) or cell type (GM12878, lavender; HCT116, orange; CD4+ T-cells, gray; MCF-7, blue).


