
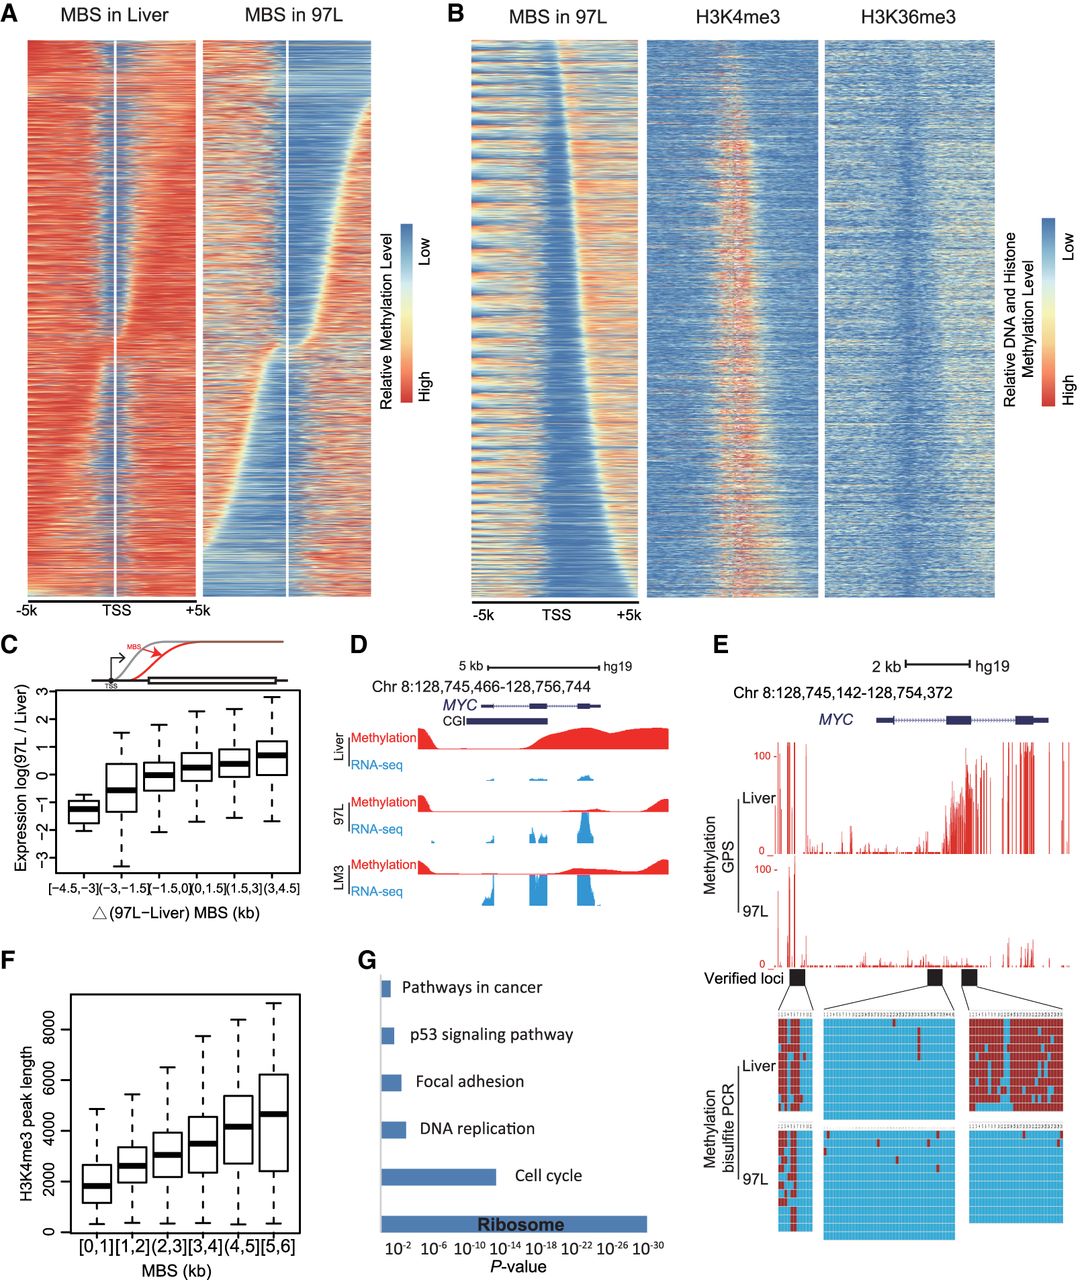
Methylation Boundary Shift (MBS) in the promoter region modulates gene expression. (A) MBS in 97L cells displaying MBS extension to the upstream or downstream from TSS compared with Liver cells. Genes are arranged from top to bottom according to the length and direction of MBS. (B) H3K4me3 and H3K36me3 in 97L display a mutually exclusive enrichment within the MBS region. H3K4me3 enrichment and length are in agreement with MBS, where H3K36me3 is mutually exclusive. (C) MBS extension is positively related to gene expression in the box plot. The x-axis is the delta MBS (difference between 97L and Liver), and the y-axis is the 97L/Liver expression ratio. Gene expression is up-regulated with the MBS increase. Schematic MBS is displayed in the upper panel. (D) MBS is related to MYC up-regulation in hepatoma cells. Smoothed methylation (in red) shows the MBS to downstream in hepatoma cells, whereas MYC expression (in blue) is increased compared with liver cells. (E) MBS in the promoter of MYC is observed and verified by bisulfite sequencing PCR in three sequential loci (black block). Each red line represents a CpG site, and its height represents methylation level (upper). Each column represents a CpG site, and each line represents a picked TA clone by Sanger sequencing. Red blocks represent methylated CpGs, and blue blocks represent unmethylated CpGs (lower). (F) Length of the H3K4me3 peak is positively correlated with MBS downstream from TSS. The y-axis represents the length of the H3K4me3 peak, and the x-axis is the MBS extension downstream from TSS. (G) Ribosomal genes are significantly enriched in genes whose up-regulation is accompanied by MBS. Compared with liver cells, KEGG analysis displays that up-regulated genes with MBS extension downstream from TSS in 97L are enriched in terms such as ribosome and cell cycle, which are important for tumorigenesis.


