
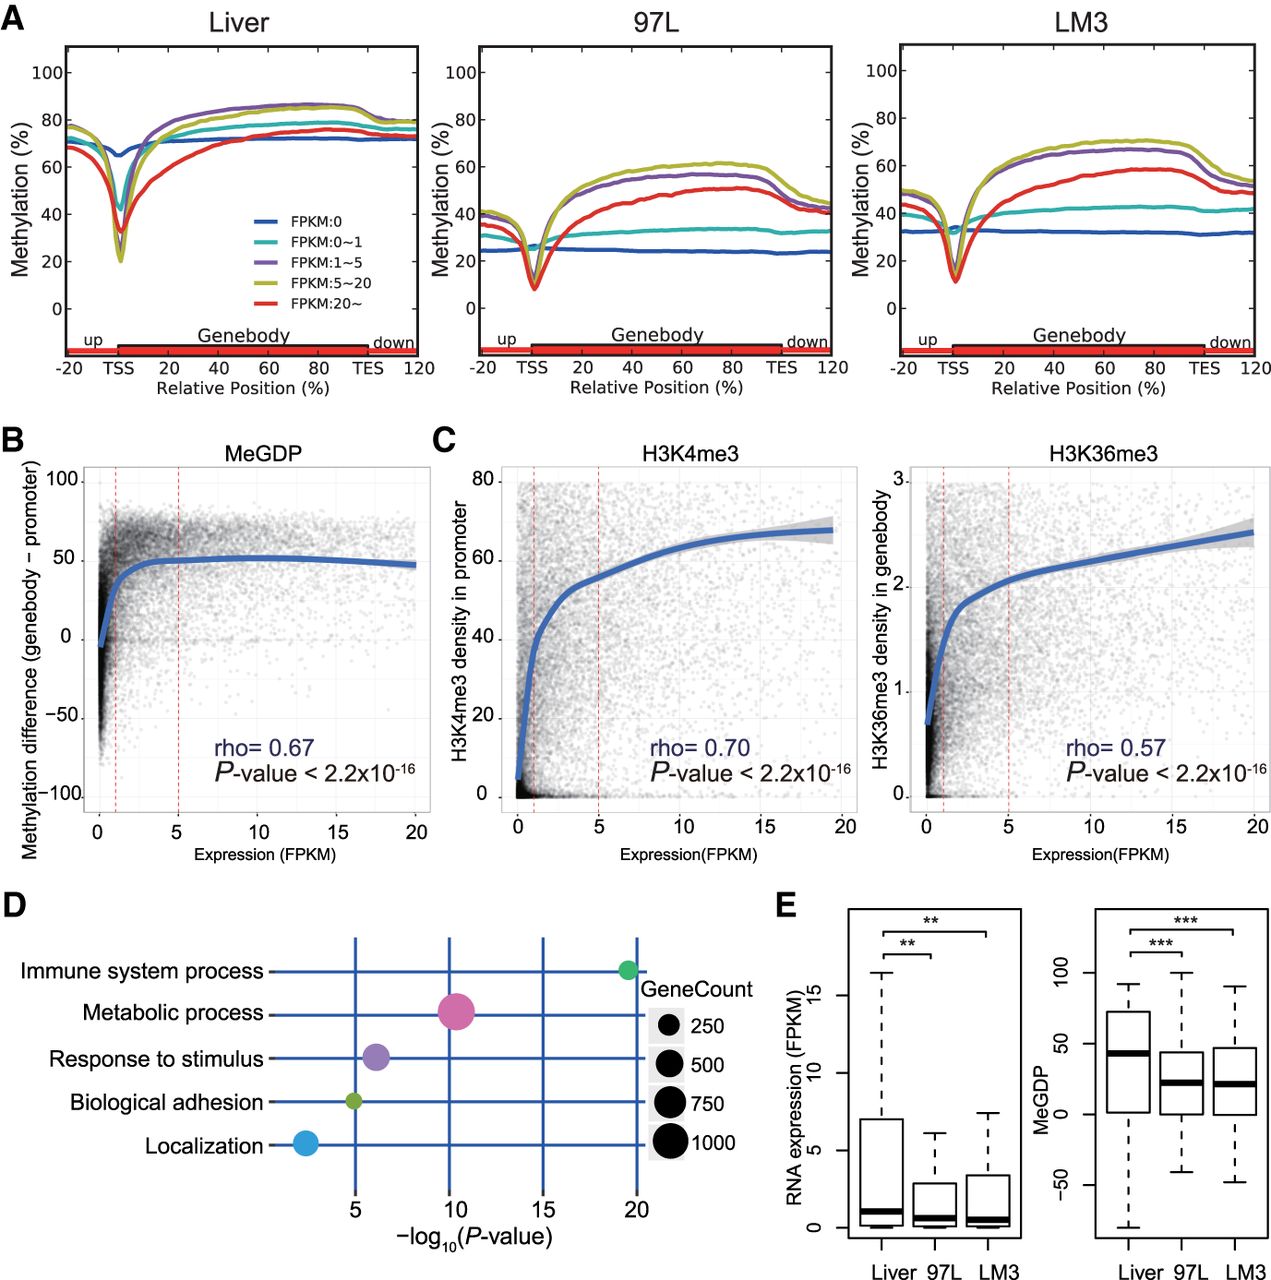
DNA methylation difference between gene body and promoter coordinates in regulating gene expression related to tumor-immune surveillance network. (A) Distribution of methylation level on promoter and gene body according to gene expression of FPKM (Fragments Per Kilobase of exon per Million fragments mapped) in Liver and hepatoma cell line 97L and LM3. Grouped genes are based on FPKM as FPKM = 0, 0–1, 1–5, 5–20, and more than 20. Highly expressed genes exhibit gene body hypermethylation and promoter hypomethylation and vice versa, except genes with FPKM more than 20 (red line). (B) Correlation between DNA methylation and gene expression FPKM in 97L with a Spearman's rank correlation coefficient of 0.67. The y-axis represents the numeral methylation difference between gene body and promoter, and the x-axis represents the gene FPKM. (C) Correlation between gene expression and H3K4me3 in promoter (left) or H3K36me3 in gene body (right) in 97L. Both H3K4me3 and H3K36me3 are positively correlated with gene expression when FPKM is more than 5. (D) Immune surveillance and tumor metabolism-related genes associated with aberrant DNA methylation. Decreased expressed genes with MeGDP reduction in 97L compared with Liver are enriched in GO terms correlated with tumorigenesis, like immune system process, response to stimulus as well as metabolic process and biological adhesion. (E) Gene expression of 102 interferon gamma pathway genes related to immune surveillance is down-regulated in hepatoma cells compared with Liver, where MeGDP is decreased accordingly. Wilcoxon matched pairs test: (**) P-value <0.01; (***) P-value <0.001.


