
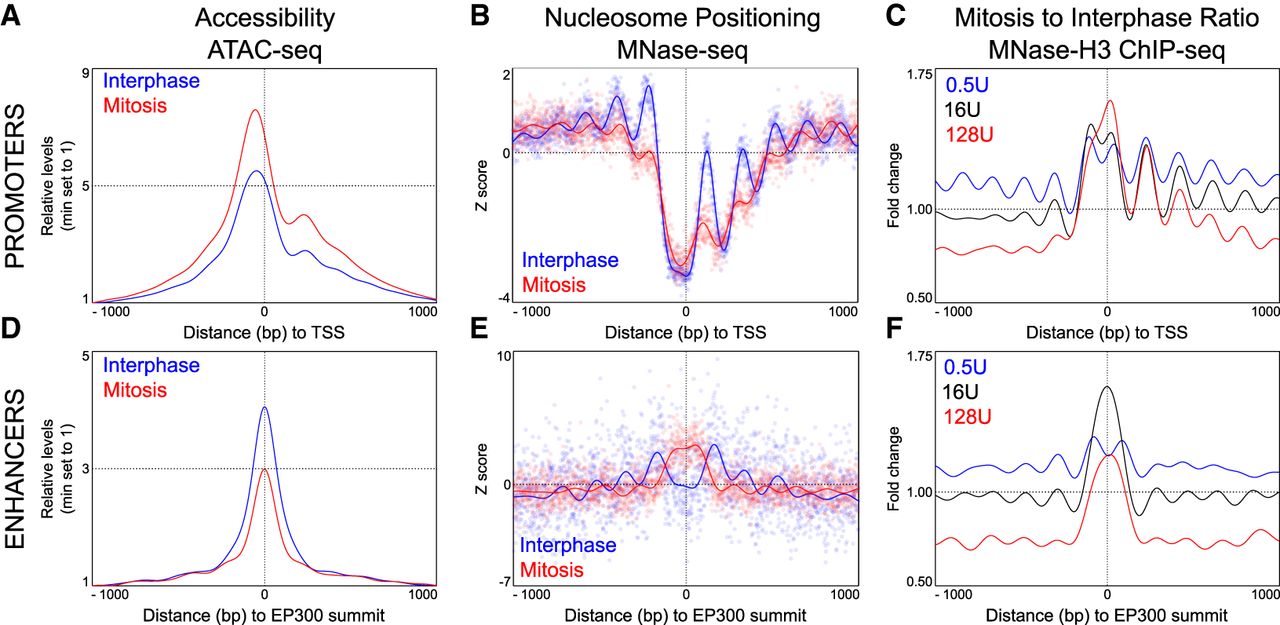
The nucleosome landscape of promoters and enhancers in interphase and in mitosis. (A) Accessibility profiles measured by ATAC-seq in the region surrounding the TSS of active genes in interphase (blue) or mitosis (red). Signal is the number of Tn5 cut sites for 0–100 bp fragments, normalized to minimum accessibility in ±1000-bp windows. Depth normalized data can be found in Supplemental Figure S8B. See Supplemental Methods for details. (B) Nucleosome positioning at the same set of promoters, established by MNase-seq. In this panel, the z-score of the number of midpoints of nucleosome-sized fragments (140–200 bp) per base, after digestion with 16 U of enzyme, are plotted. The lines represent a Gaussian process modeling nucleosome positioning (see Supplemental Methods) in interphase (blue) and in mitosis (red). (C) Mitosis over interphase ratio of MNase H3 ChIP-seq signal for nucleosomal fragments (as assessed by Gaussian process regression) (see Supplemental Methods). Ratios shown for MNase digestions with 0.5 U (blue), 16 U (black), and 128 U (red) of enzyme. Since this analysis aims at identifying quantitative changes in nucleosome occupancy, we used H3 data, as not all MNase-generated nucleosome-sized fragments are guaranteed to contain a nucleosome. (D–F) As in A–C but for regions centered on summits of interphase EP300 ChIP-seq peaks excluding promoters. Note that in E, MNase-seq signal is from 128 U digestions. Full data sets can be found in Supplemental Figure S8B.


