
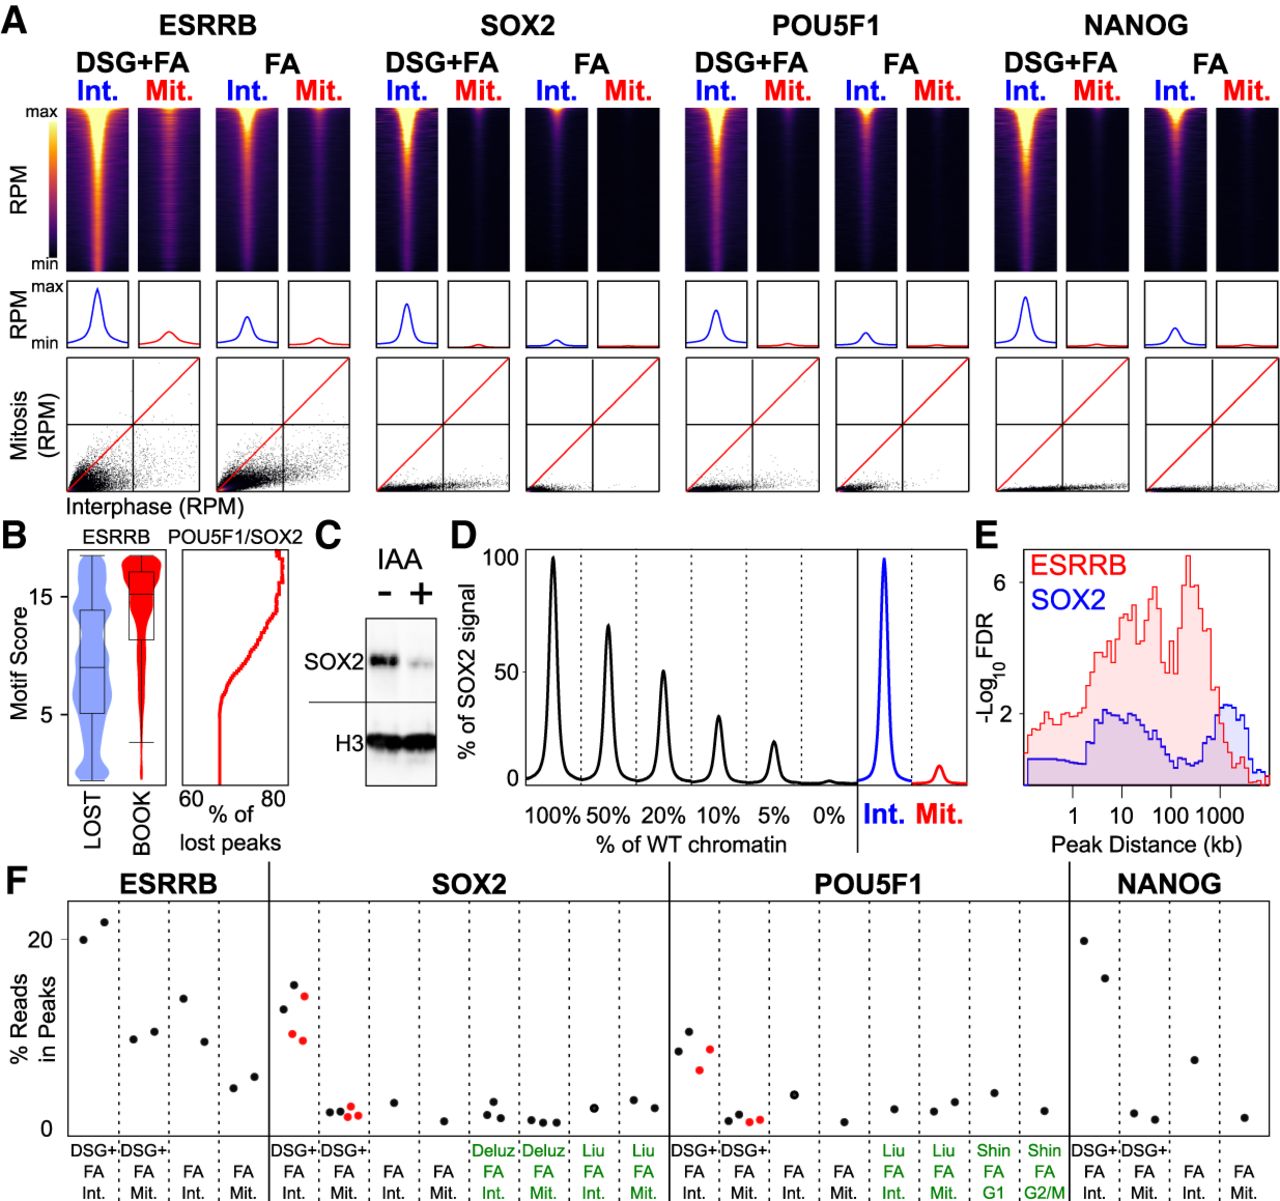
Comparative analysis of ESRRB, SOX2, POU5F1, and NANOG binding in interphase and in mitosis. (A) (Top) Heat maps of ChIP-seq signal at the indicated binding regions (±500-bp peak summit) identified in interphase (Int.) and mitosis (Mit.) for DSG+FA and FA alone. (Middle) Average binding profile of the regions shown in the heat maps. Heat maps and average binding profiles display reads per million (RPM); the y-axis differs for each factor and is scaled by median DSG+FA interphase binding: ESRRB: 0–1.5 RPM, SOX2: 0–3.2 RPM, POU5F1: 0–2.6 RPM, NANOG: 0–2.7 RPM. (Bottom) Scatter plots of ChIP-seq signal in reads per million at the above regions for interphase and mitosis (DSG+FA scale 0–40 RPM; FA scale 0–20 RPM). (B) Violin plots (left) depicting the FIMO-called best motif score per ESRRB peak in sites losing binding in mitosis (LOST) or retaining binding (BOOK). (Right) Percentage of lost peaks with a composite POU5F1/SOX2 motif of at least the given quality score. (C) Levels of SOX2-AID fusion protein in cells cultured in the absence (−) or presence (+) of the Auxin analog IAA for 2 h; H3 is shown as a control. (D) Percent of the SOX2 ChIP signal detected at binding regions after spiking increasing amounts of WT chromatin into chromatin prepared from SOX2-depleted cells shown alongside the average SOX2 binding profile at potentially bookmarked regions in WT cells in interphase and mitosis. (E) Enrichment of genes responsive to ESRRB (red) and SOX2 (blue) in early G1 as a function of the distance to ESRRB or SOX2 bookmarked regions, respectively, displayed as −log10 Fisher FDR. (F) Percentage of ChIP-seq reads in identified binding sites for ESRRB, SOX2, POU5F1, and NANOG, in both interphase (Int.) and mitosis (Mit.) and DSG+FA or FA fixation in our data (black labels) and public data sets (green labels). The red dots correspond to the samples that were added to our study to further corroborate our results.


