
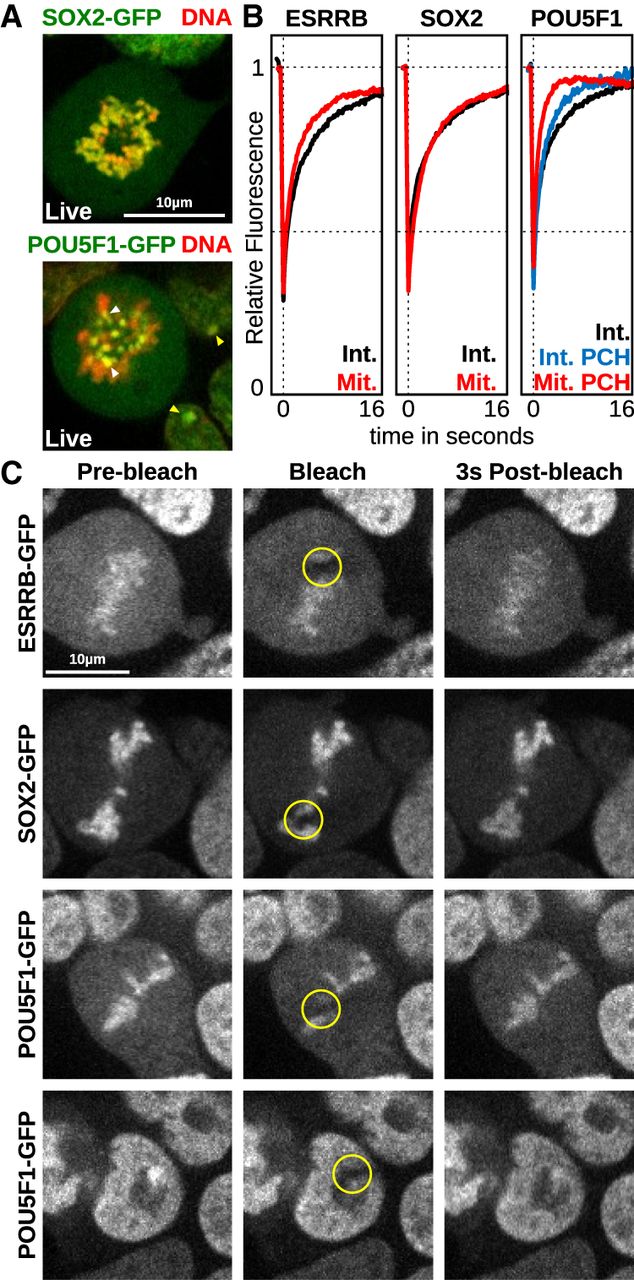
The interactions captured by DSG are dynamic. (A) Localization of SOX2-GFP (top) or POU5F1-GFP (bottom) fusion proteins (green) in live cells cultured with Hoechst 33342 (red). Arrowheads indicate pericentric heterochromatin foci (PCH) in interphase (yellow) and centromeres in mitosis (white). (B) Quantifications of FRAP experiments in interphase (black) and mitosis (red) performed in cells expressing ESRRB-GFP or SOX2-GFP. For cells expressing POU5F1-GFP, recovery of fluorescence at (blue) or outside of (black) pericentric heterochromatin foci is displayed for interphase. Recovery at PCH is displayed for mitosis (red). The y-axis shows the mean percentage of fluorescence relative to prebleach levels detected in multiple independent experiments; the x-axis shows the time after bleaching. (C) Representative examples of ESRRB-GFP, SOX2-GFP, and POU5F1-GFP signal on mitotic chromosomes before and after bleaching, at the indicated time. For POU5F1-GFP, the recovery of signal at PCH is also shown for cells in interphase (bottom).


