
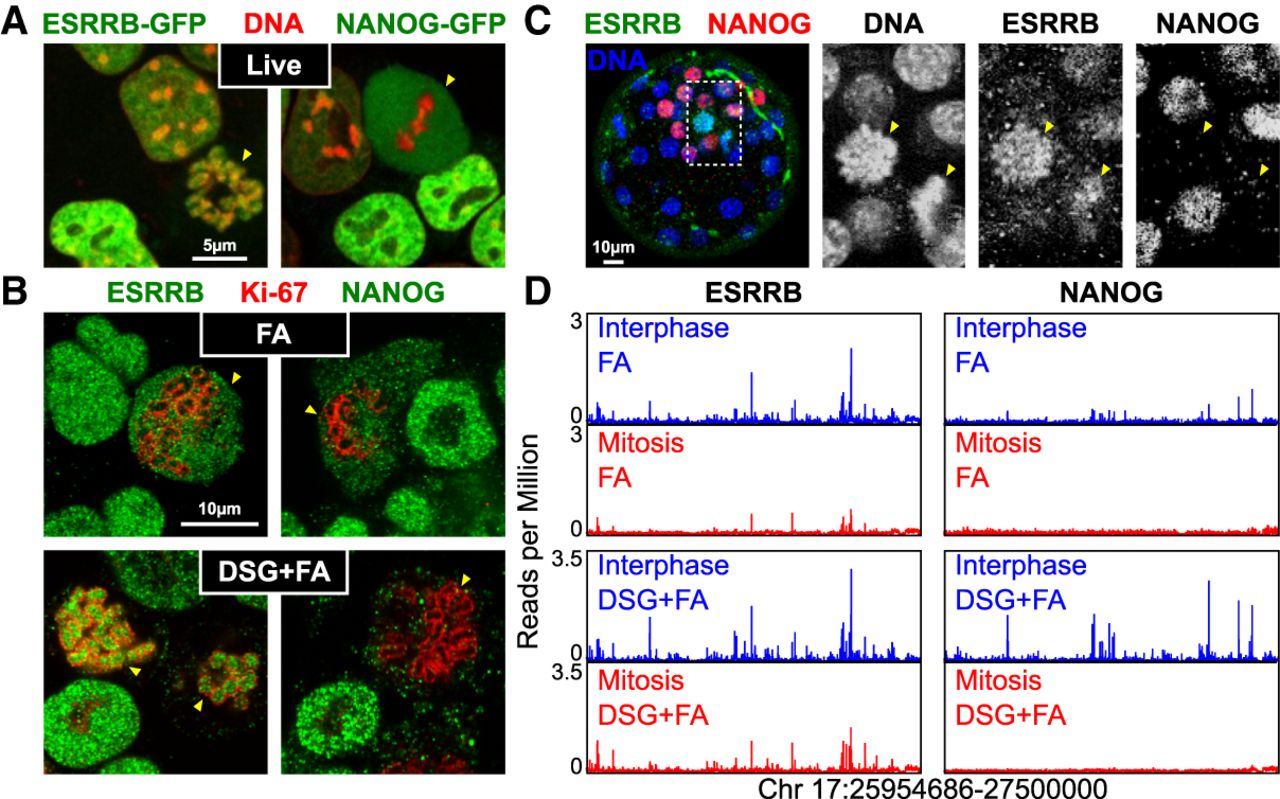
Capturing global ESRRB binding on mitotic chromosomes. (A) Localization of ESRRB-GFP (left) or NANOG-GFP (right) fusion proteins in live cells cultured with Hoechst 33342 (red). (B) ESRRB (left) and NANOG (right) immunofluorescence (green) after fixation with either FA (top) or DSG+FA (bottom). The chromosome periphery of mitotic chromosomes is identified by Ki-67 (red). (C) Immunostaining for NANOG (red) or ESRRB (green) performed on a mouse blastocyst fixed with DSG+FA. Counterstain with Hoechst 33342 is shown in blue. Close-up of two mitotic cells is shown in the right panels (dashed area delimits the selected region). Mitotic cells are indicated in A–C with yellow arrowheads. (D) Representative binding profiles of ESRRB and NANOG across 1.5 Mb in interphase (blue) or mitosis (red), obtained after fixation with either FA (top) or DSG+FA (bottom).


