
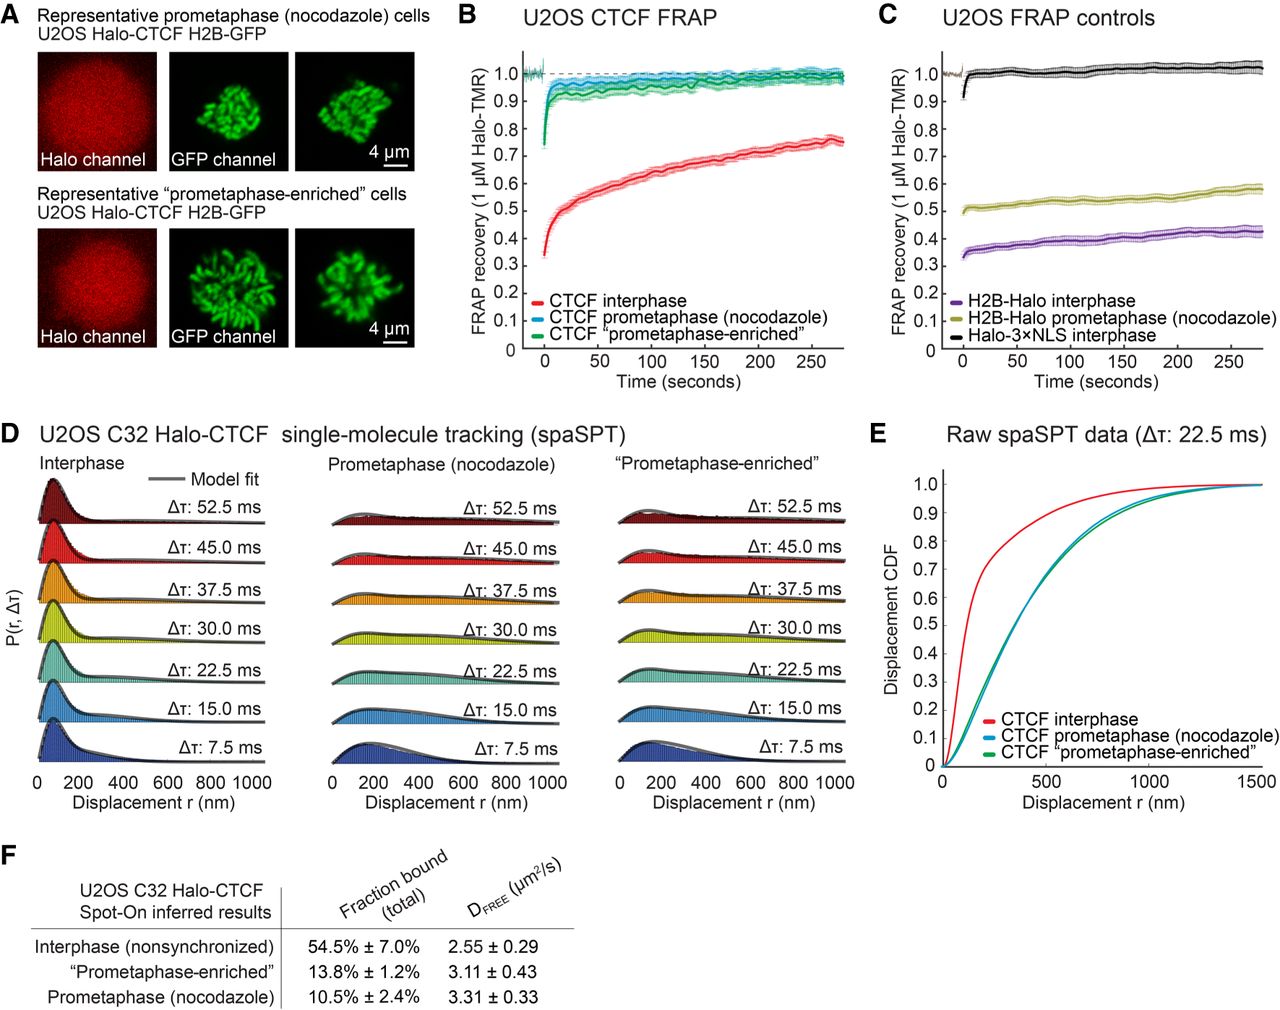
Live-cell imaging shows large loss of CTCF binding in mitosis. (A) Halo-CTCF and H2B-GFP localization of representative U2OS cells for prometaphase arrested cells and nonarrested cells selected as prometaphase (“prometaphase-enriched”). (B) FRAP for Halo-CTCF in interphase, prometaphase arrested, and prometaphase-enriched cells. (C) Controls showing FRAP for H2B-Halo in interphase and prometaphase arrested cells and for Halo-3×NLS in interphase cells. (D) Single-particle tracking displacement statistics for Halo-CTCF in different timeframes in interphase, prometaphase arrested, and prometaphase-enriched cells. (E) Displacement cumulative distribution function (CDFs) derived from single-particle tracking at Δτ 22.5 msec for interphase, prometaphase arrested, and prometaphase-enriched cells. (F) Fraction bound of Halo-CTCF calculated using the Spot-On model in interphase, prometaphase arrested, and prometaphase-enriched cells (Hansen et al. 2018a).


