
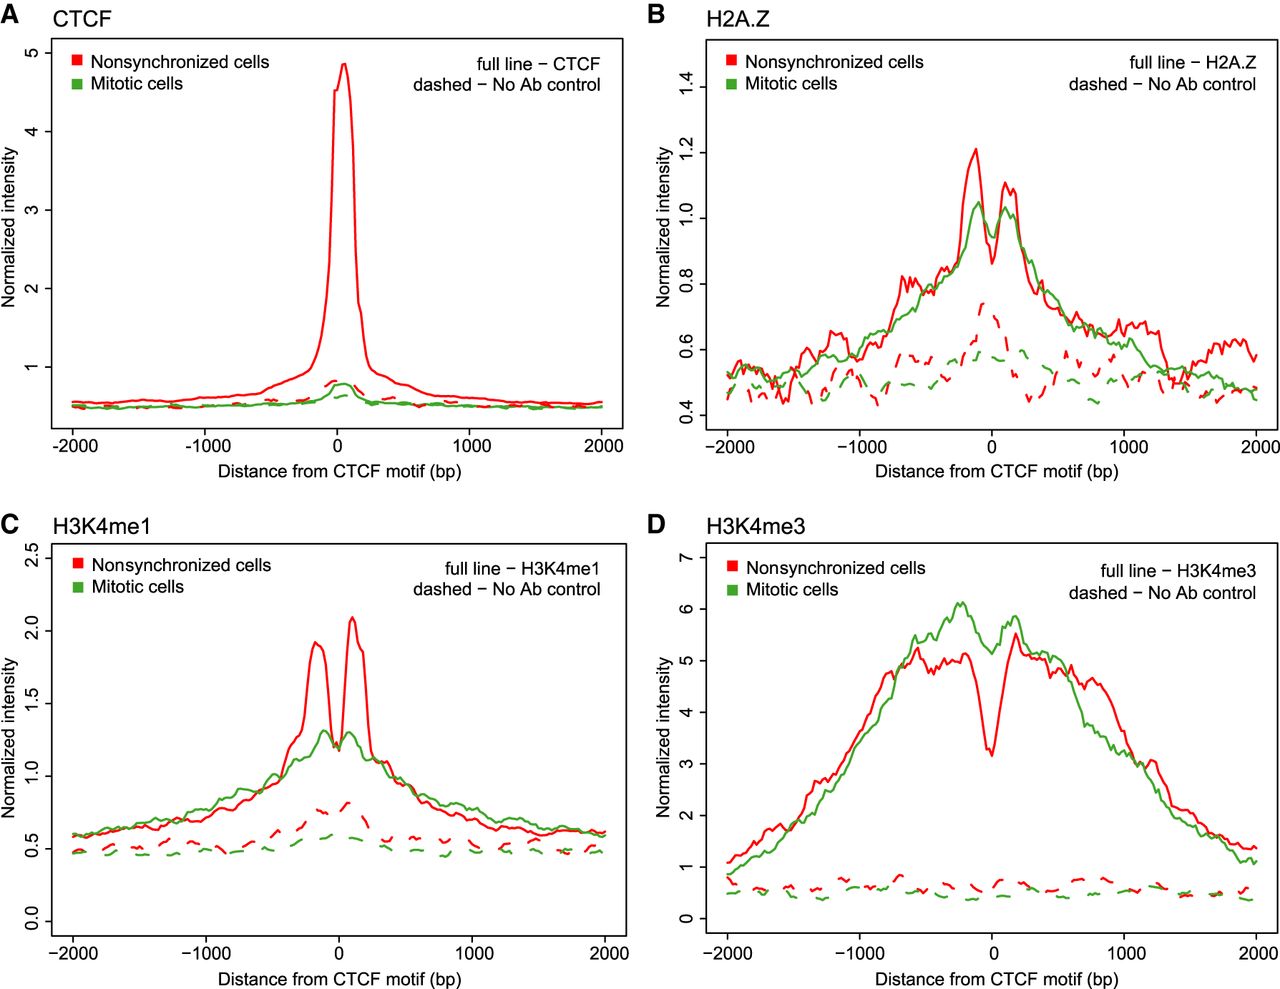
Figure 5.
CUT&RUN data show loss of CTCF binding at CTCF motifs in mitosis, while H2A.Z and H3K4 methylation marks are maintained. (A) Aggregation plot of CTCF CUT&RUN signal of reads shorter than 120 bp after 10 min digestion. Reads are aggregated on CTCF motifs that display an interphase ATAC-seq peak. (B–D) CUT&RUN signal for H2A.Z (B), H3K4me1 (C), H3K4me3 (D) of reads longer than 120 bp after 30 min digestion. Reads are aggregated at CTCF motifs with interphase ATAC-seq peak.


