
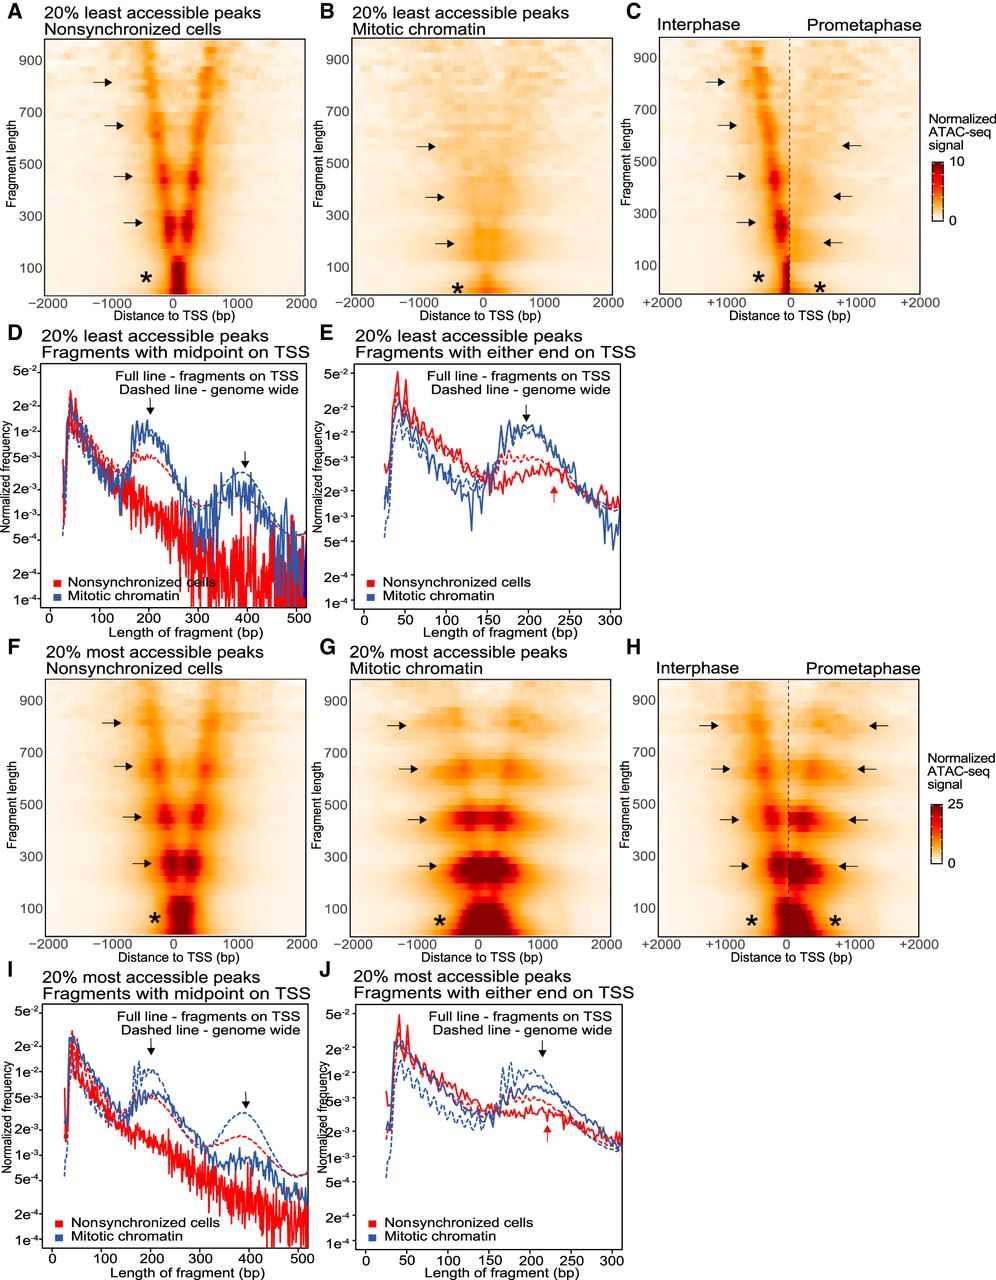
ATAC-seq V-plots show nucleosome repositioning, while accessibility is maintained at transcription start sites. (A–E) ATAC-seq data for the set of TSSs that display the lowest 20% accessible peaks in mitotic chromatin; (F–J) ATAC-seq data for the set of TSSs that display the highest 20% accessible peaks in mitotic chromatin. (A,B) V-plots of ATAC-seq signal aggregated at TSSs in nonsynchronized cells (A) and mitotic chromatin (B). (C) Side-by-side comparison of the V-plots of low accessible TSSs for nonsynchronized cells and mitotic chromatin. (D) Distribution of fragment length of reads with their midpoint on a TSS compared to the genome-wide average (dashed line): (arrows) read lengths representing 1 and 2 nucleosomes. (E) Distribution of fragment length of reads with either end in a TSS in mitotic chromatin compared to the genome-wide average (dashed line). In interphase, reads representing one flanking nucleosome are longer (red arrow) compared with reads representing one flanking nucleosome in mitosis (black arrow). (F,G) V-plots of ATAC-seq signal aggregated at TSSs that display the highest 20% accessibility in mitotic chromatin for nonsynchronized cells (F) and mitotic chromatin (G). (H) Side-by-side comparison of the V-plots shown in F and G. (I) Distribution of fragment length of reads with their midpoint on a TSS with highest 20% highest accessible peaks in mitotic chromatin compared with genome-wide average (dashed line): (arrows) read lengths representing 1 and 2 nucleosomes. (J) Distribution of fragment length of reads with either end in a TSS with highest 20% highest accessible peaks in mitotic chromatin compared with the genome-wide average (dashed line). For mitotic chromatin, reads representing one flanking nucleosome are of similar length (black arrow) compared with reads representing one flanking nucleosome in interphase (red arrow).


