
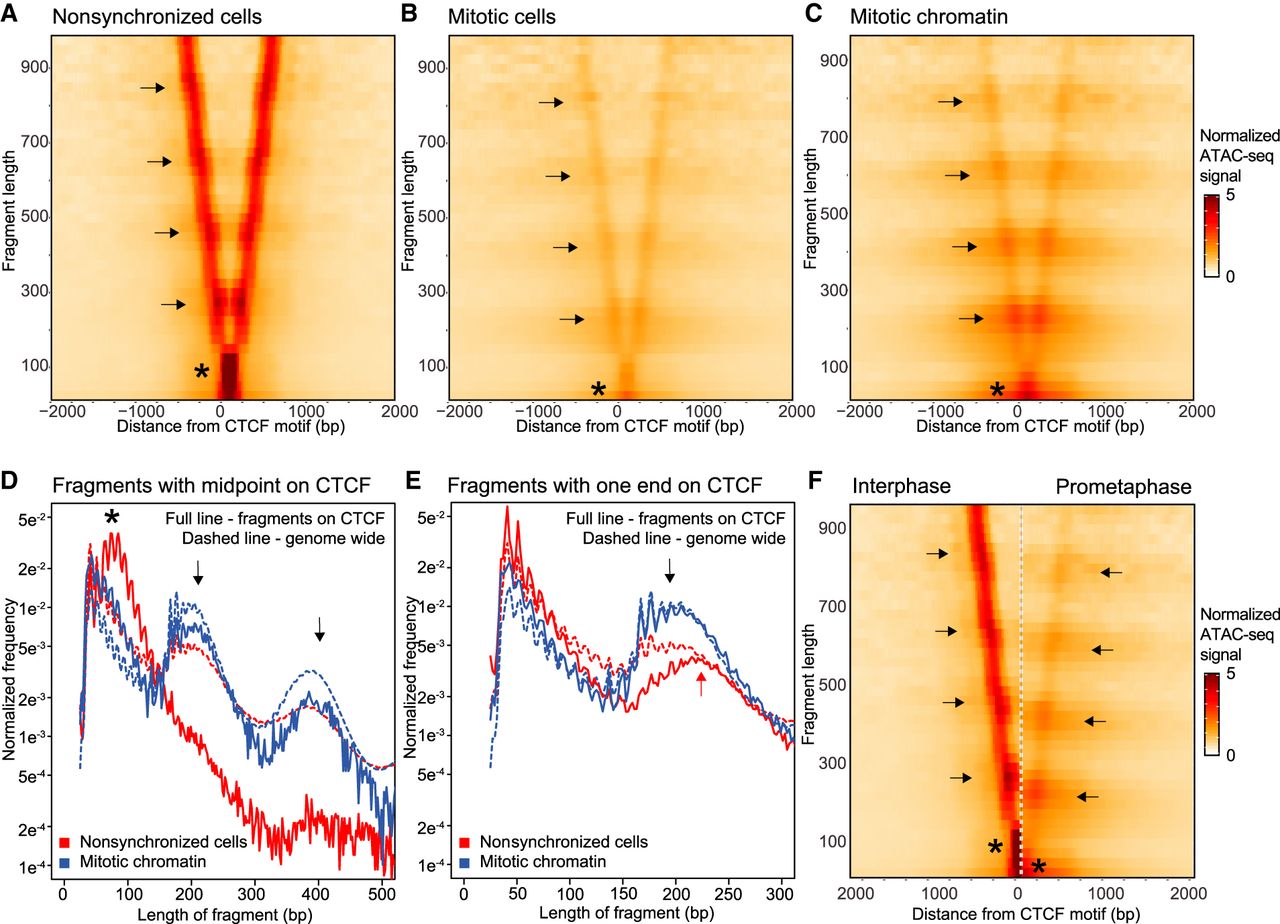
ATAC-seq data represented in V-plots show loss of CTCF binding in mitosis and rearrangement of nucleosomes flanking CTCF motifs. (A–C) ATAC-seq data represented in V-plots aggregated at CTCF sites. The lengths of ATAC-seg reads are plotted on the y-axis, and the distance between their midpoints and the CTCF motif is shown on the x-axis. (A) V-plot for interphase ATAC-seq data. Asterisk indicates the CTCF footprint. Enriched dots along the arms of the V (arrows) represent strongly positioned nucleosomes. (B,C): V-plots for ATAC-seq data from mitotic cells and purified mitotic chromatin aggregated at CTCF motifs with interphase ATAC-seq peaks. Asterisks mark the loss of the CTCF footprint. Arrows indicate positioning of flanking nucleosomes. (D) Distribution of fragment lengths of reads that have their midpoint on a CTCF motif: (dashed line) genome-wide average read length distribution; (arrows) read lengths representing one and two nucleosomes. (E) Distribution of fragment length of reads with either read end near a CTCF motif with interphase ATAC-seq peak compared to the genome-wide average (dashed line). In interphase, reads representing one flanking nucleosome are longer (red arrow) as compared to reads representing one flanking nucleosome in mitosis (black arrow). (F) Side-by-side comparison of V-plots for nonsynchronized and mitotic chromatin. The shift in nucleosome positioning is highlighted using arrows. Asterisks mark loss of CTCF footprint in mitosis.


