
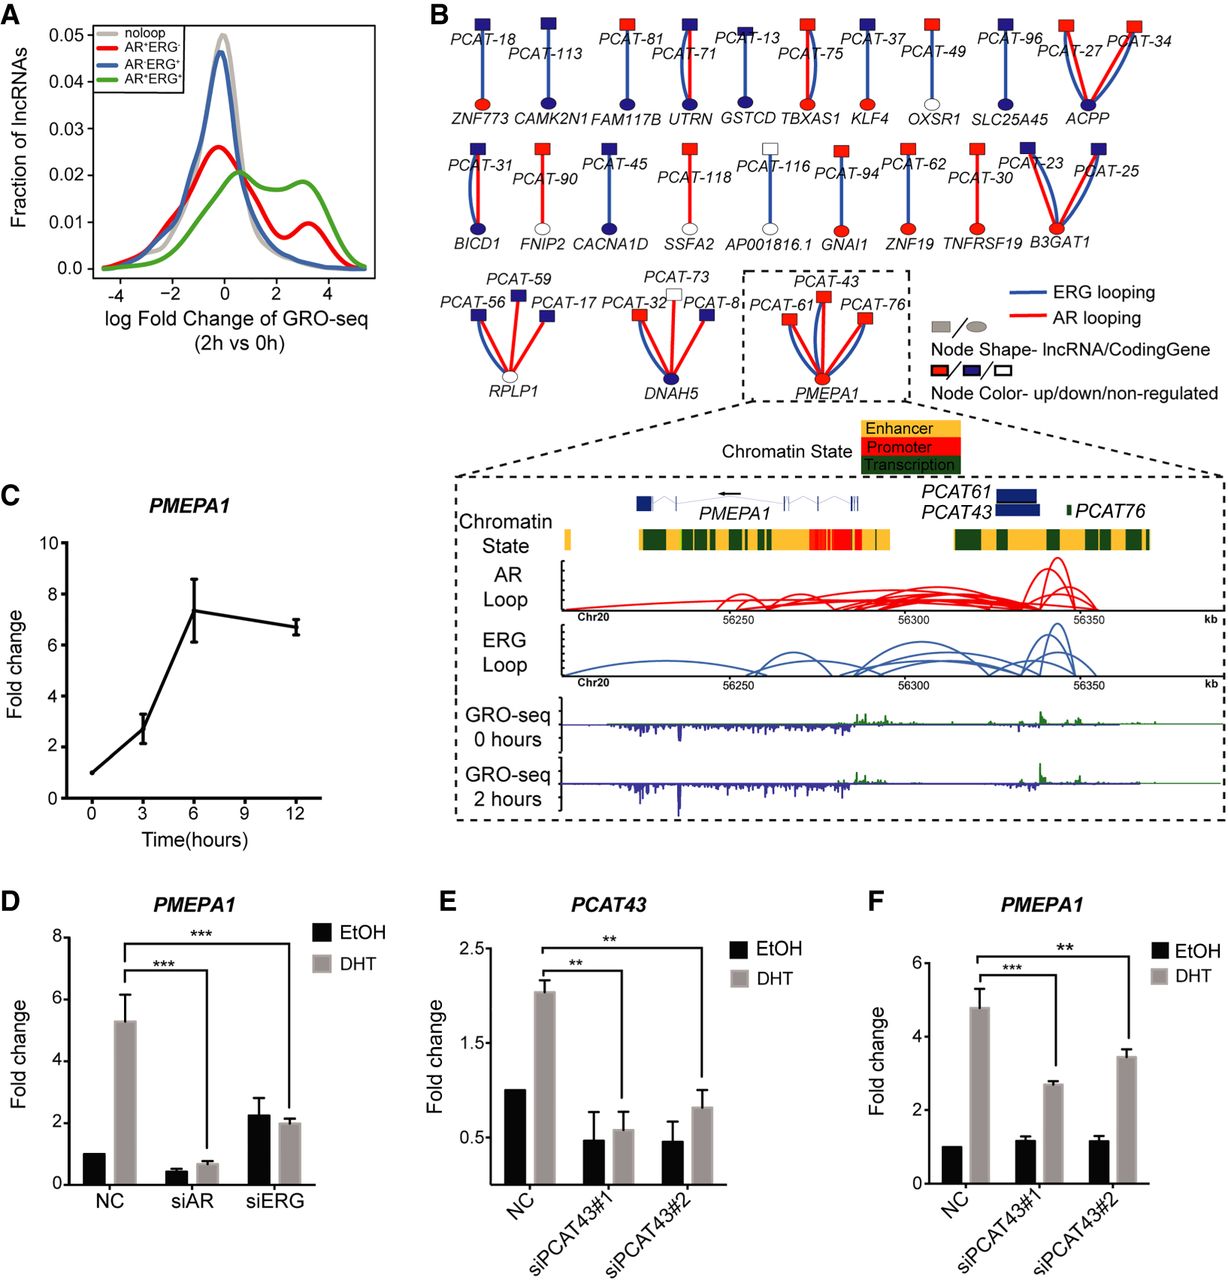
Functional relationship between lncRNA and chromatin loops in the AR-ERG transcriptional network. (A) Distribution of lncRNA expression change from 0 to 2 h after DHT treatment as measured by GRO-seq. Genes were classified into four categories depending on their association with different loop types. The x-axis shows the log fold change of the lncRNA expression, and the y-axis is the fraction of genes in the given lncRNA categories. (B) Bipartite graph linking clinically relevant lncRNAs to coding genes by AR/ERG looping. The node shape indicates the molecule type (lncRNA or coding gene), and the node color represents a more than 1.5-fold expression increase (red) or decrease (blue) after DHT treatment. Lower panel: An example showing three clinically relevant lncRNAs linked to the gene PMEPA1 by AR-ERG co-associated looping. Snapshot representation of (from top to bottom) gene track and ChromHMM track, the ERG and AR loops (defined by ChIA-PET), and transcriptional rate profiles before and after DHT (defined by GRO-seq). (C) Graph showing the time-dependent activation of PMEAP1 in VCaP cells after treatment with 10 nM DHT. (D) Bar graph showing the expression of PMEAP1 in VCaP cells transfected with siNC, siAR, or siERG and treated with DHT or EtOH for 6 h. (E) Transcribed from the same genomic region, PCAT43 and PCAT76 transcripts are indistinguishable from each other. Bar graph showing the efficiency of siRNA-mediated knockdown of PCAT43 in VCaP cells. (F) Graph showing the effect of PCAT43 knockdown on the androgen regulation of PMEAP1. VCaP cells transfected with siPCAT43 were treated with DHT or EtOH for 6 h.


