
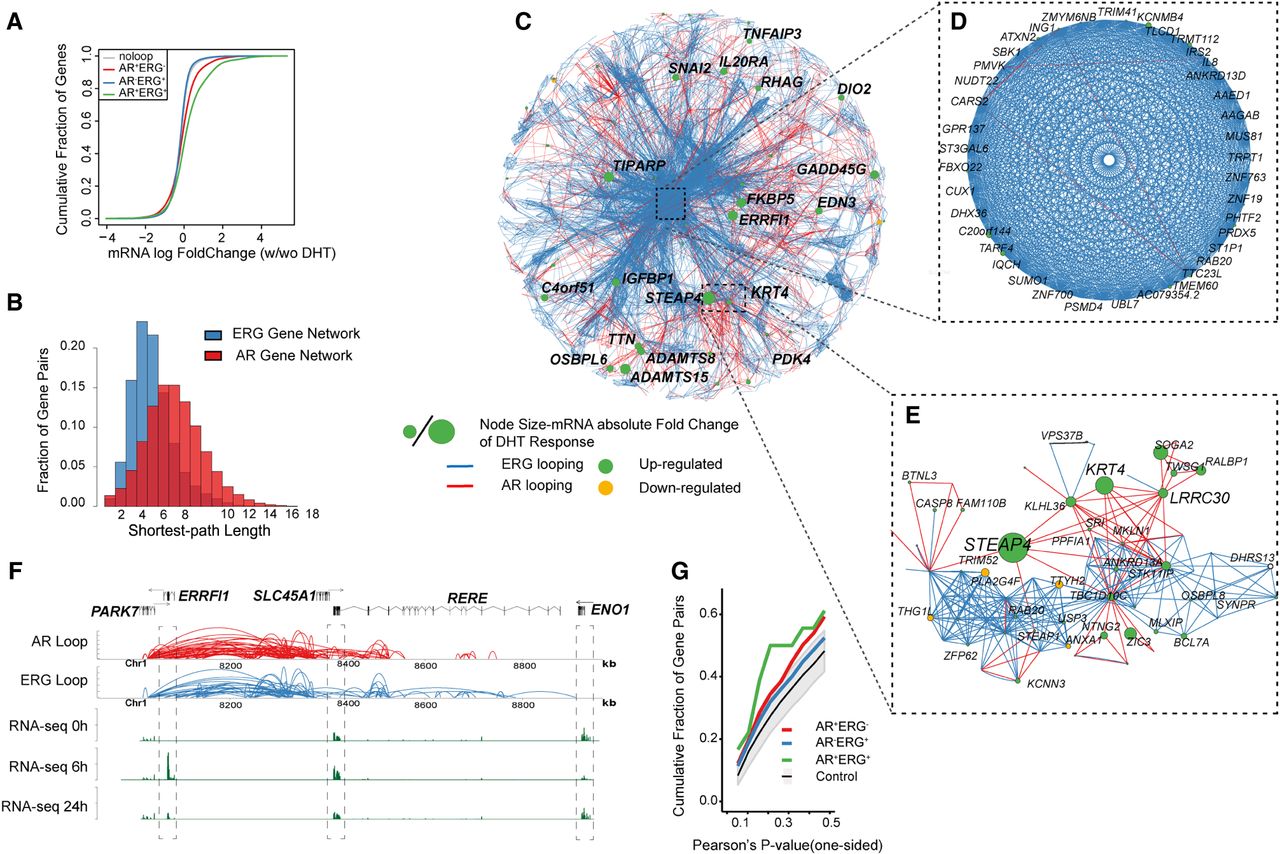
Transcriptome network defined AR and ERG interactome in prostate cancer. (A) Distribution of mRNA expression changes at 0 and 2 h after DHT treatment. mRNA changes are classified into four categories depending on the association with different types of loops. The x-axis shows the log fold change of the gene expression by RNA-seq data, and the y-axis is the cumulative fraction of genes in the given gene categories. (B) The distribution of shortest path lengths between any two genes in the AR or ERG loop defined gene networks. (C) Cytoscape (Shannon et al. 2003) map of the largest connected component of the gene network defined by both AR and ERG associated loops. Each node is a gene, and the node size represents the absolute log fold change of the mRNA expression at 0 and 2 h after DHT treatment. The edge color represents either AR looping (red) or ERG looping (blue). (D) A zoomed view of a core gene network showing 39 genes highly inter-connected by ERG loops and a few AR loops. (E) Zoomed in subnetwork view of the neighborhood of genes with STEAP4. (F) A browser track view of genes linked by AR-ERG co-associated looping. From top to bottom: the gene track, AR looping track, ERG looping track, RNA-seq signal at 0 h, RNA-seq signal at 6 h, and RNA-seq signal at 24 h after DHT treatment. (G) Cumulative fraction of gene pairs against the Pearson's correlation P-value of their expression across four time points after DHT treatment (based on microarray data). The P-value is one-sided and the alternative hypothesis is that the correlation is greater than zero. The green curve is for gene pairs linked by AR-ERG co-associated looping, the red curve is for gene pairs linked by AR looping only, and the blue curve is for gene pairs linked by ERG loops only. The gray color band denotes the 95% confidence interval of the same number of randomly selected gene pairs as in the AR-ERG co-association.


