
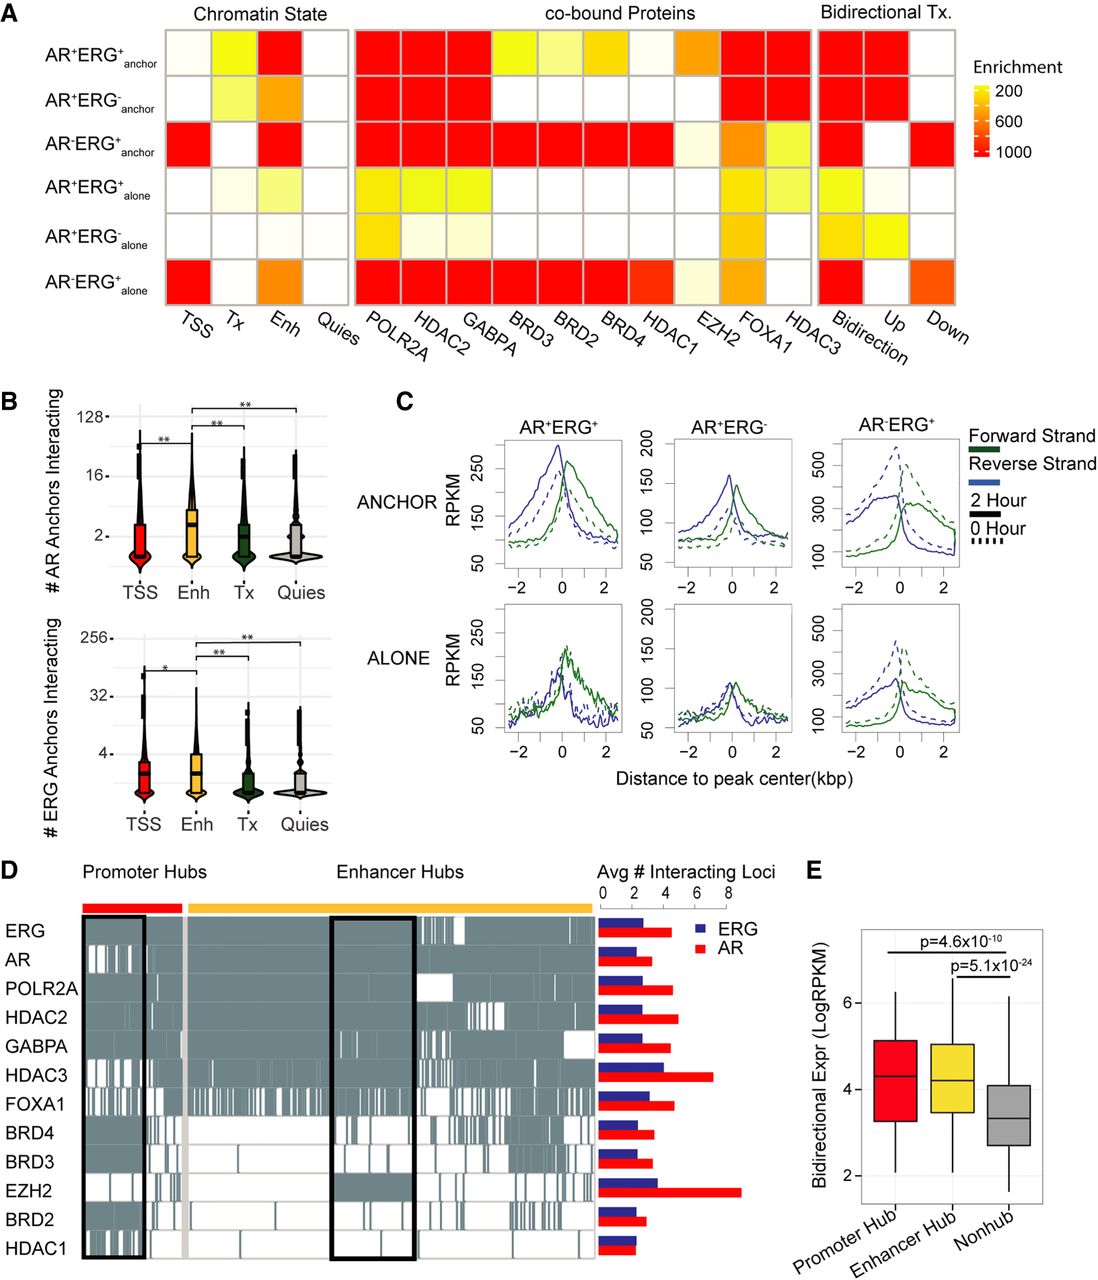
Regulatory signatures of the AR and ERG interactome in prostate cancer. (A) Dissecting AR/ERG binding sites into six categories based on AR/ERG binding status and whether the binding sites associate with either AR loops or ERG loops. The left heat map presents enrichment of different chromatin states in the six categories of AR/ERG binding. The middle heat map presents enrichment of cotranscription factor ChIP-seq peak regions in VCaP cells. The three columns of the right heat map present enrichment of regions with bidirectional transcription 2 h after DHT treatment, with increasing bidirectional transcription in the middle column and decreasing bidirectional transcription on the right. The enrichment was computed as the negative log binomial P-value of the overlapping fraction of peaks in a given category (row) with the given annotation feature (column). The ENCODE combined DNase peaks (open chromatin) overlapping fractions are used as the null distribution. (B) Distribution of the number of interacting anchors comprising four different chromatin states in the AR anchored network (top) and ERG network (bottom). The Wilcoxon rank-sum test was applied to test if the number of anchors in the enhancer state is higher than other chromatin states. (*) P-value = 1.6 × 10⁻⁷, (**) P-value < 2.2 × 10⁻¹⁶. (C) GRO-seq profile around six categories of AR/ERG binding sites. The forward strand GRO-seq signal is presented in green and the reverse strand in blue. The dashed line represents the GRO-seq signal before DHT treatment, and the solid line represents the GRO-seq signal 2 h after DHT treatment. (D) Left: Binary heat map representation of the distribution of listed transcription factor binding sites in promoter and enhancer hub regions. Each column represents one genomic region, with rows representing TF binding sites. The black boxes illustrate two TF clusters in promoter hub regions and enhancer hub regions. Right: Bar plot shows the average number of interacting loci for the AR (red) or ERG (blue) anchor regions with different TF binding. (E) Box plot showing the average bidirectional expression level (2 h after DHT treatment) of promoter hub regions (red), enhancer hub regions (yellow), and nonhub anchor regions (gray). The bidirectional expression level is defined by the minimum reads per kilobase per million mapped reads (RPKM) of two strands.


