
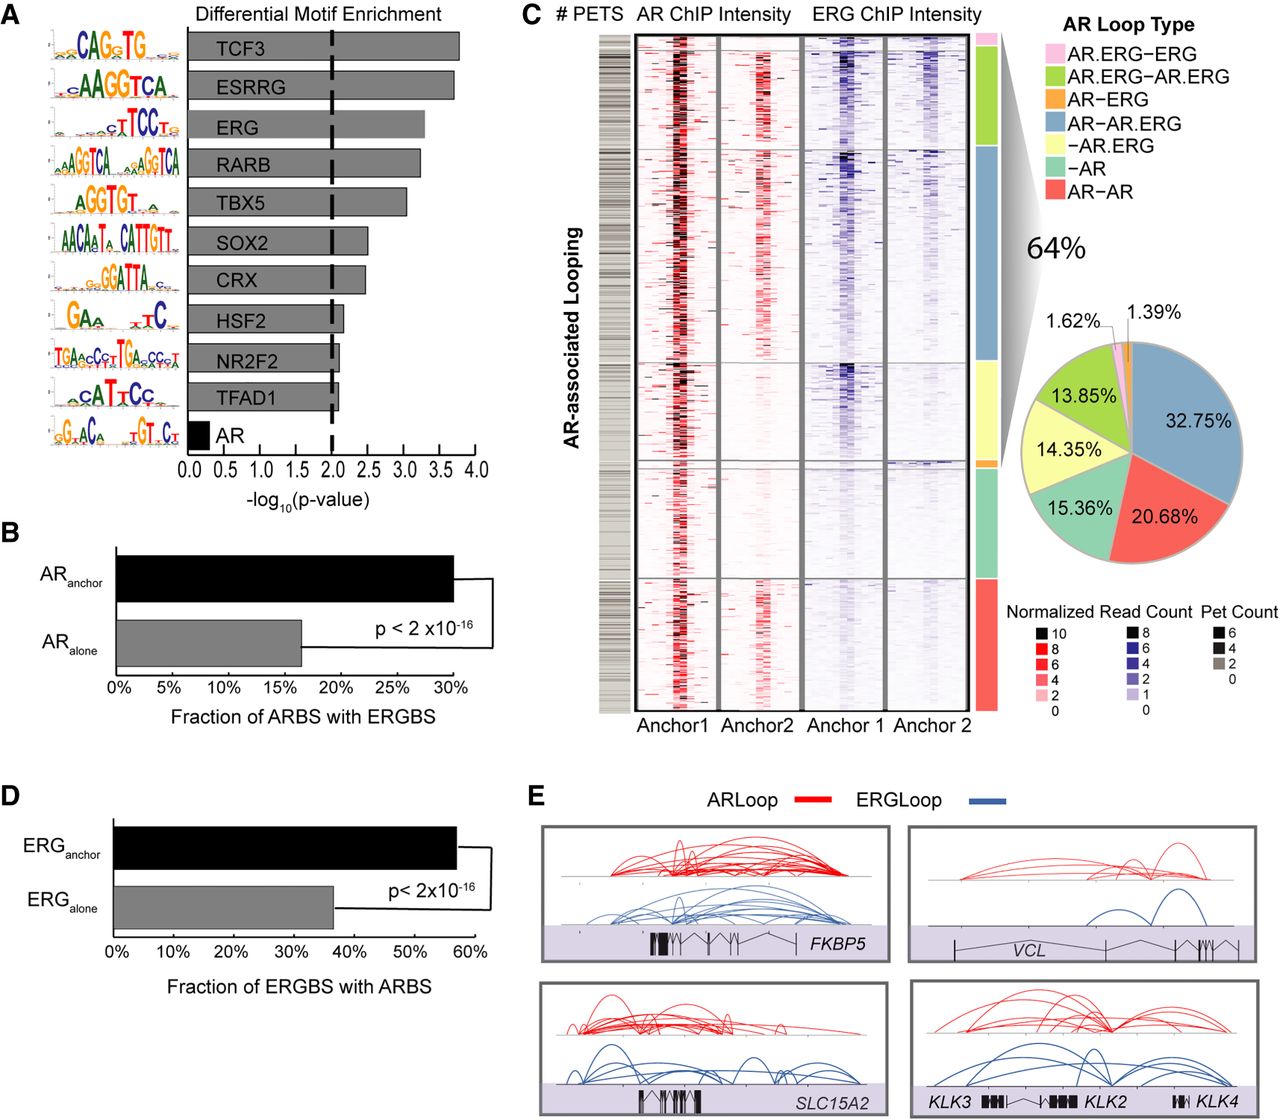
ERG binding is involved in AR-associated chromatin looping. (A) Bar chart showing the top 10 motifs enriched at interacting ARBS (ARanchor) compared to noninteracting ARBS (ARalone). There is no difference in AR motif enrichment between the two sets. (B) Fraction of ARanchor with colocalized ERGBS compared to ARalone. (C) Left: Heat map depiction of the AR and ERG ChIP intensity (±5 kbp) centered at AR anchor pairs. Each row is one AR loop represented by two anchor regions, and AR loops are classified into seven categories based on the occupancy status of AR and ERG at both anchors. Right: Pie-chart summarizing the fraction of different categories. (D) Fraction of interacting ERGBS (ERGanchor) with colocalized ARBS compared to noninteracting ERGBS (ERGalone). (E) Snapshots depicting the interconnectivity of AR/ERG-associated chromatin interactions at model androgen-regulated genes.


