
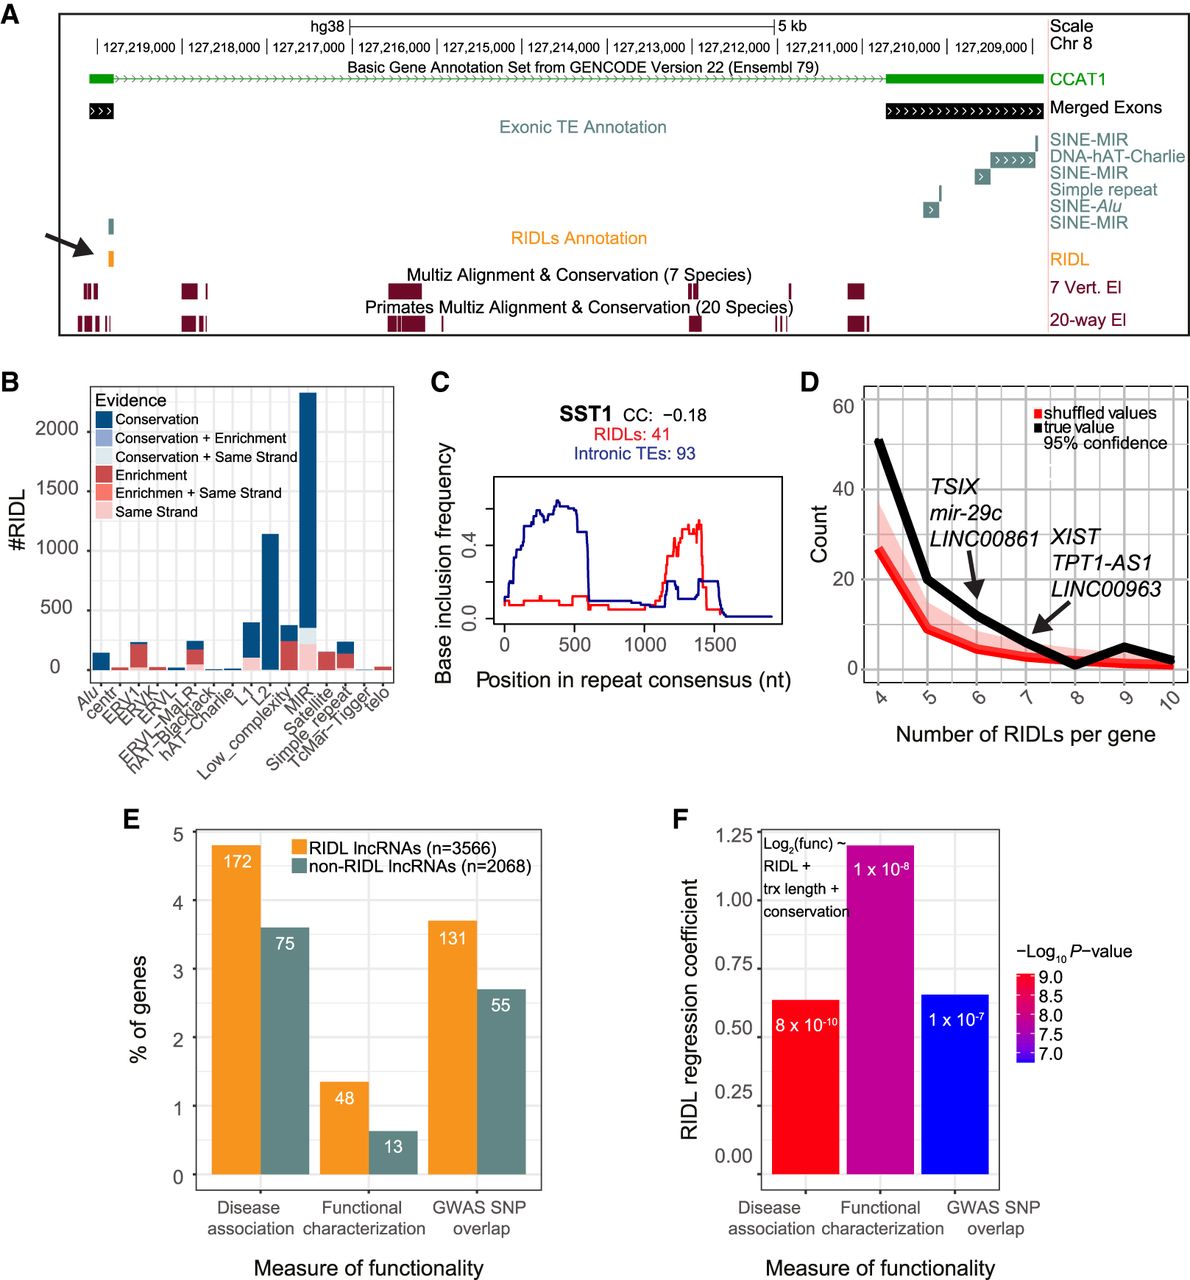
Annotated RIDLs and RIDL-lncRNAs. (A) Example of a RIDL-lncRNA gene, CCAT1. Of note is that although several exonic TE instances are identified (gray), including three separate MIR elements, only one is defined a RIDL (orange) because of overlap of a conserved element. (B) Breakdown of RIDL instances by TE family and evidence sources. (C) Insertion profile of SST1 RIDLs (blue) and intronic insertions (red): x-axis shows the entire consensus sequence of SST1; y-axis indicates the frequency with which each nucleotide position is present in the aggregate of all insertions. (CC) Spearman's correlation coefficient of the two profiles; (RIDLs or intronic TEs) the numbers of individual insertions considered for RIDLs/intronic insertions, respectively. (D) Number of lncRNAs (y-axis) carrying the indicated number of RIDL (x-axis) given the true distribution (black) and randomized distribution (red). The 95% confidence interval was computed empirically by randomly shuffling RIDLs across the entire lncRNA annotation. (E) Percentage of RIDL-lncRNAs, and a length-matched set of non-RIDL lncRNAs, which are present in disease- and cancer-associated lncRNA databases (see Methods) or in the lncRNAdb database of functional lncRNAs (functional characterization) or contain at least one trait/disease-associated SNP in an exonic region (GWAS SNP overlap). Numbers denote gene counts. (F) Plot shows regression coefficients for the “RIDL” term in the indicated multiple logistic regression model using the same measures of functionality as in E. Colors indicate the associated P-value. These values assess the correlation between RIDL number and measures of functionality of their host transcript, while accounting for transcript length (trx length) and conservation.


