
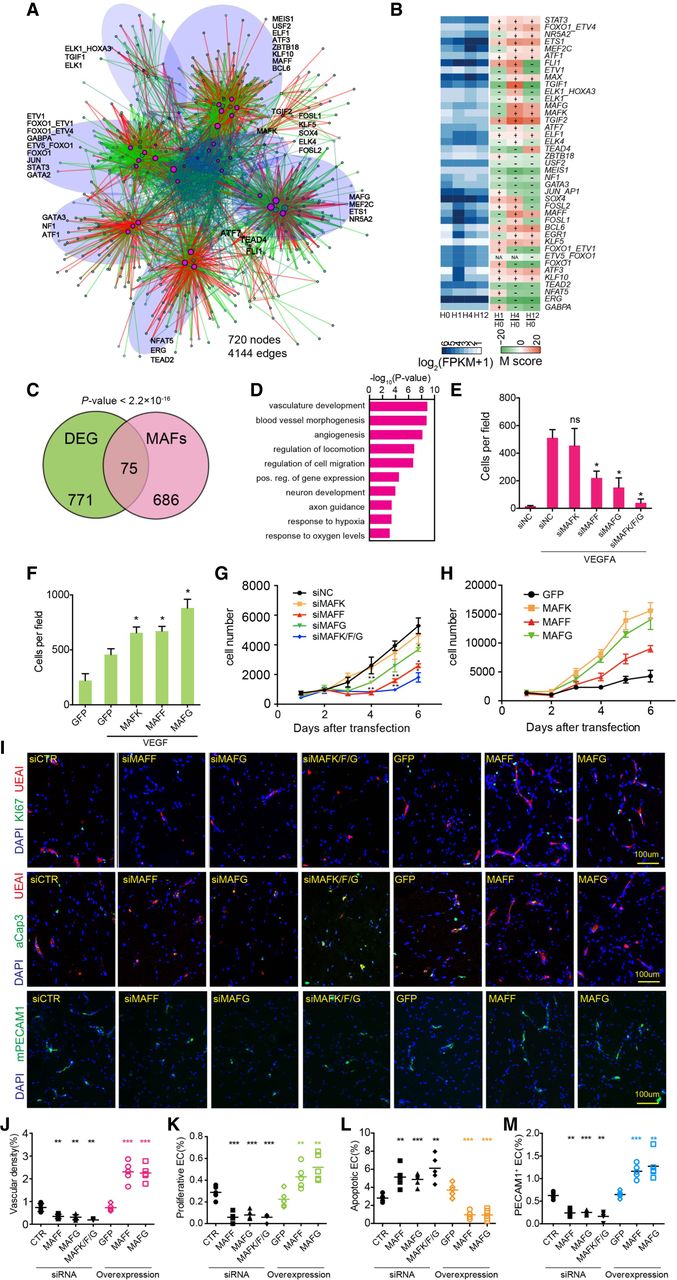
MAF factors are master regulators (MRs) of endothelial cell VEGFA responses and angiogenesis. (A) The VEGFA transcriptional gene regulatory network. Nodes are DEGs, expressed TFs whose motifs are significantly enriched at AEs, or proteins that interact with the aforementioned factors. MR nodes identified by MARINa are highlighted in magenta, whereas other nodes are colored green. Edges represent TF–target gene interactions, as determined by ChIP-seq or inferred from enriched AE motifs. Edges with a positive expression correlation are colored red, and those without are colored green. Light blue edges represent protein–protein interactions from the STRING database. Node size represents the number of connected edges. Transparent blue ellipses circled different modules, and MRs in each module are highlighted nearby in black. (B) MRs of VEGFA transcriptional responses in endothelial cells inferred by MARINa. The blue heatmap (left) represents the relative expression of the indicated TFs over the time course. The orange heatmap (right) displays the relative enrichment score (M-score) for TF targets among DEGs at hours 1, 4, and 12 compared with hour 0. Positive and negative M-scores indicate positive or negative correlation between a TF and its target DEGs at the labeled time point. All MAF family members (MAFF, MAFG, and MAFK) were identified as MRs. (C) Overlap between DEGs and predicted MAF targets, inferred by the presence of the MAF motif in adjoining AEs. Enrichment P-value over genome-wide expectation was calculated using a Fisher's exact test. (D) Enriched Gene Ontology terms of predicted MAF target genes (adjacent to AEs containing the MAF motif). The top 15 most significant GO terms are shown. (E) Inhibition of MAFF or MAFG, but not MAFK, suppressed HUVEC cell migration induced by VEGFA. Cell migration was measured using the transwell assay. (F) Overexpression of MAFF, MAFG, or MAFK augmented VEGFA-induced migration, as measured by the transwell assay. (G) Inhibition of MAFF or MAFG, but not MAFK, dampened HUVEC cell proliferation. Cell number was measured using a tetrazolium dye reduction assay. (H) Lentiviral overexpression of MAFF, MAFG, or MAFK promoted HUVEC cell proliferation. (I) Matrigel plug assay to assess role of MAF proteins in angiogenesis in vivo. (I–M) Matrigel plug assay to assess role of MAF proteins in angiogenesis in vivo. HUVECs with knockdown or overexpression of MAFF and MAFG were mixed with stromal cells and Matrigel and injected subcutaneously into nude mice. One week later, vascular density (J), the fraction of MKI67 (also known as Ki-67) positive human endothelial cells (K), and caspase 3-positive human endothelial cells (L) were measured. PECAM1 staining was used to evaluate the invaded blood vessels from host mice (M). n = 5. Student's t-test: (**) P-value <0.01; (***) P-value <0.001. (I) Representative images of immunostained Matrigel plug sections.


