
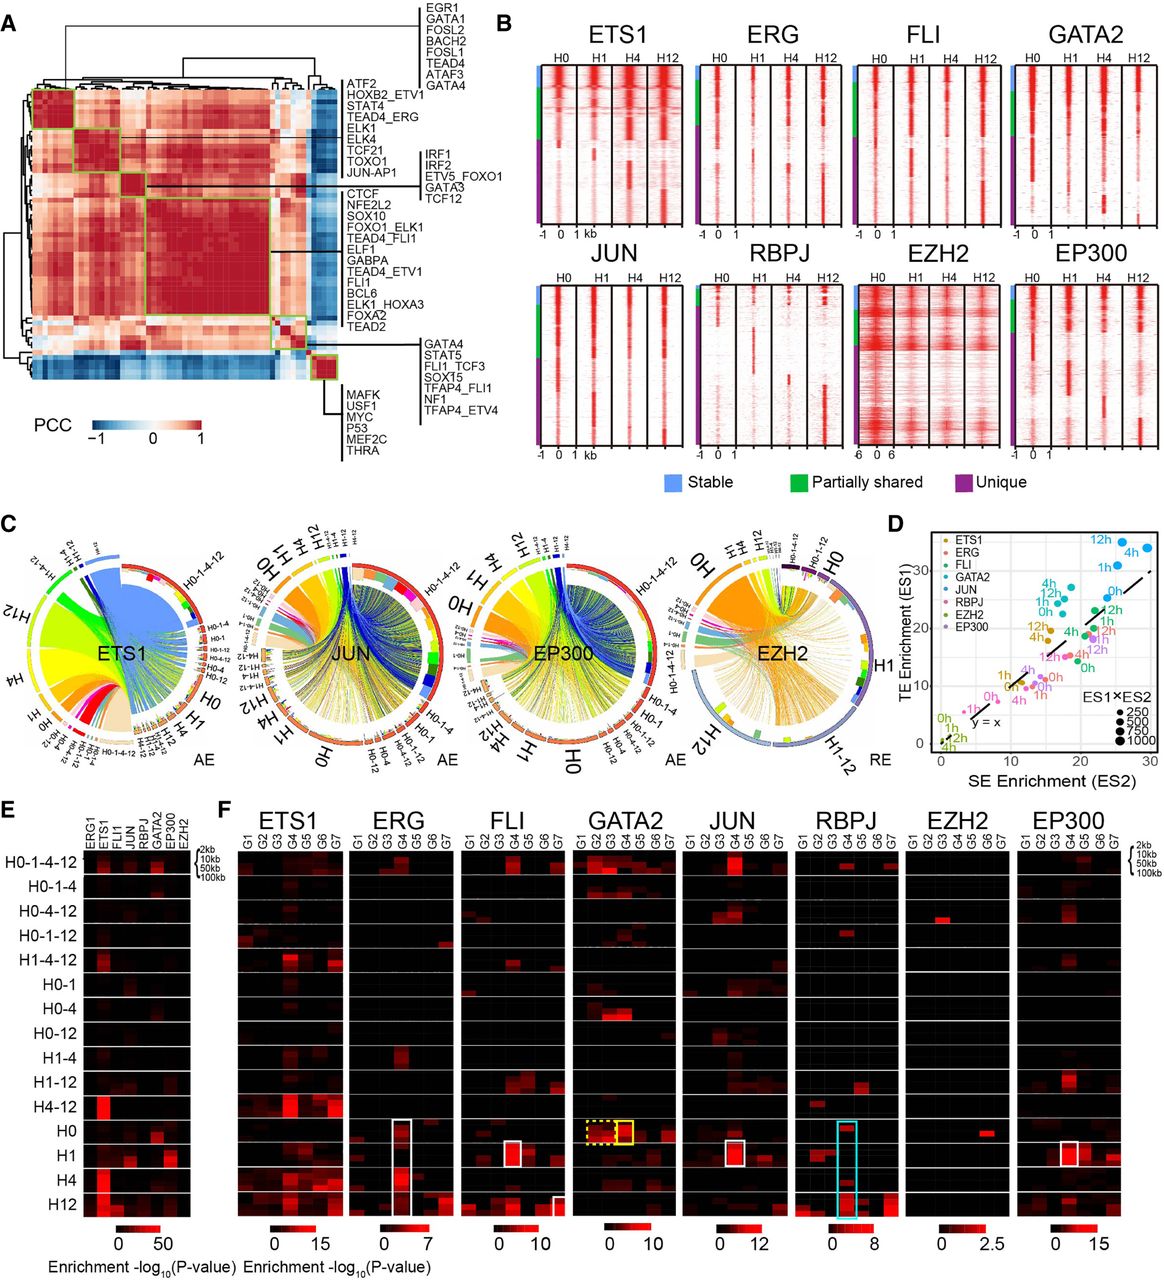
TF dynamics are linked to VEGFA-induced changes in the chromatin landscape and transcriptome. (A) Co-association of motifs at enhancers. AEs were scored for presence of motifs, and the frequency that regions contained two different motifs was calculated. Six major groups of co-associated TFs were found (green rectangles). The members of these groups are labeled on the right. (B) Chromatin occupancy of six TFs and two epigenetic enzymes. Regions were grouped based on their temporal pattern of factor binding, from binding at all time points (“stable,” top) to binding at some but not all time points (“partially_shared”), to binding at a single time point (“unique”). VEGFA stimulated dramatic changes in chromatin occupancy by these eight proteins, as demonstrated by the large majority of regions being bound at a subset of time points (“partially_shared” and “unique”). (C) Linkages between ETS1, JUN, EP300, and EZH2 peaks and AEs visualized in Circos plots (Krzywinski et al. 2009). TFS and AE clusters were defined as in Figures 4A and 6A. Each line represents an overlap between a TF and an AE cluster and is colored by the associated TF cluster. The bar plots on the inner side of the circle indicate the enrichment value of TF clusters on AE or RE clusters. (D) The enrichment of tested transcriptional regulators at SEs and typical enhancers (TEs). The size of the dot represents the TF enrichment on both TEs and SEs. The enrichment score was calculated as the sum of peaks on TEs and SEs normalized by the total number of peaks across the whole genome. The dots above and below the diagonal line indicate preferential enrichment on TEs or SEs, respectively. (E) Enrichment of DEGs among genes’ neighboring regions bound by the indicated transcriptional regulator and bound in the indicated temporal pattern. DEGs were mapped to bound regions within 2, 10, 50, or 100 kb. Temporal clusters are named by time points with regulator binding, for example, H0-1-4 indicates that a peak was called on member regions at H0, H1, and H4. Enrichment P-value was calculated by Fisher's exact test. Multiple temporally dynamic TF clusters, particularly the time unique clusters, were overrepresented for DEGs. (F) Enrichment of DEG clusters among genes’ neighboring regions bound by the indicated transcriptional regulator and bound in the indicated temporal pattern. This panel is similar to D, except that DEGs are separated by the temporal expression pattern. Rectangles highlight enrichment of DEG clusters that are referred to in the text.


