
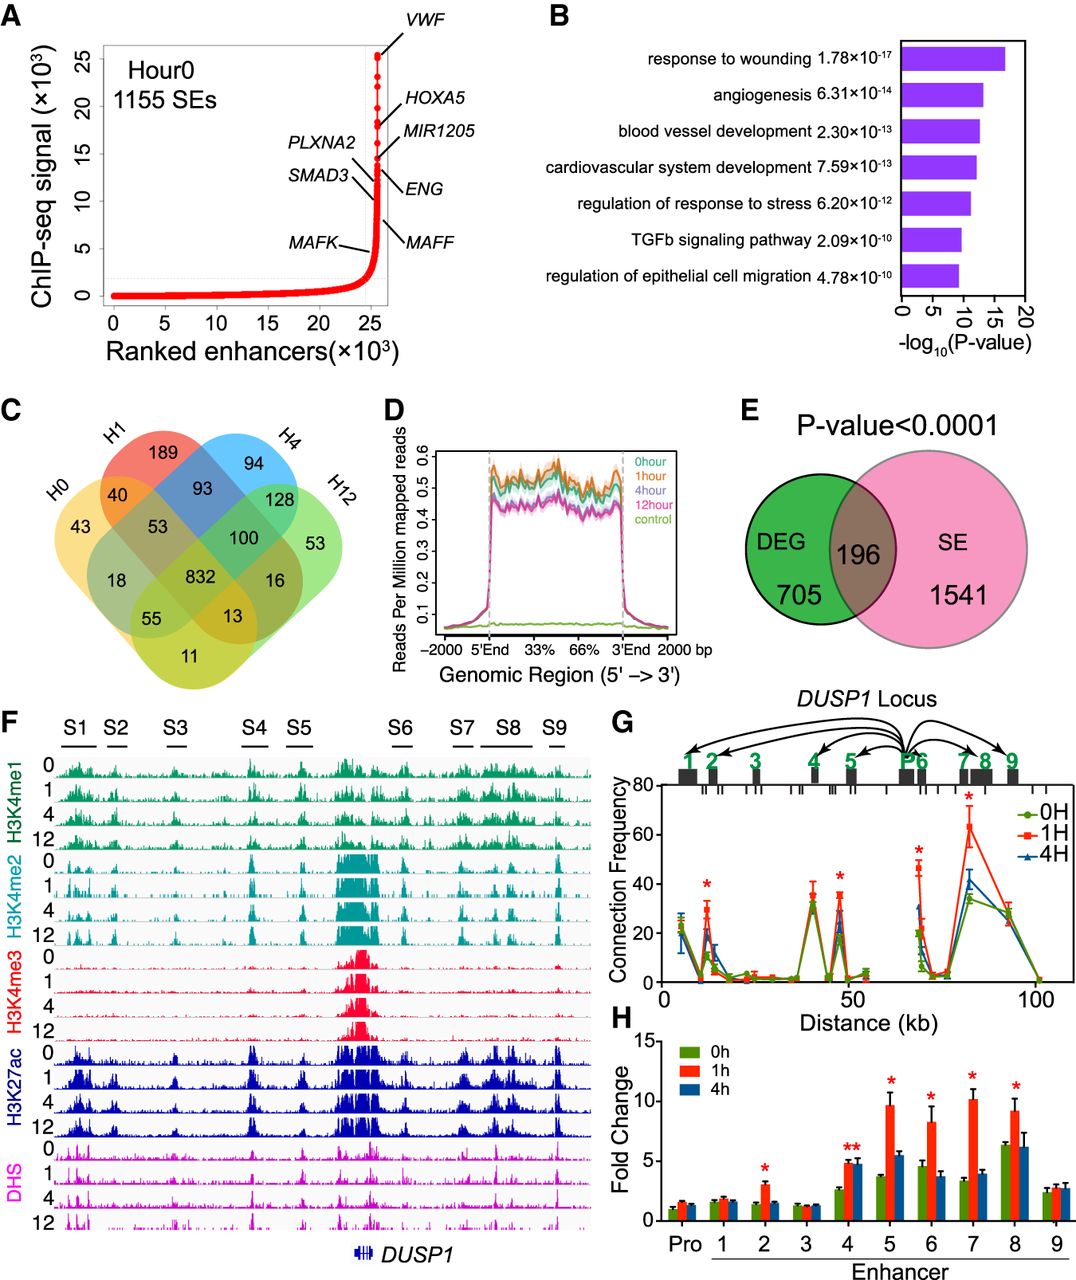
SEs preferentially regulate DEG. (A) HUVEC SEs at baseline. AEs were ranked by H3K27ac ChIP-seq signal, and nearby enhancers were stitched together using the ROSE algorithm (see Methods). Representative SE genes with critical vascular functions are highlighted. (B) Gene Ontology terms enriched among SE genes at baseline. Angiogenesis-related terms were significantly overrepresented. (C) Venn diagram showing the overlap between SEs at the four time points following VEGFA treatment. (D) Average plot of H3K27ac on SE regions at hours 0 (H0), 1, 4, and 12. VEGFA changed H3K27ac occupancy of SEs. (E) DEGs were enriched among SE genes. P-value was calculated using the χ2 test. (F) Chromatin landscape of the DUSP1 SE during VEGFA stimulation. S1–S9 represent sites of component enhancers of the SE (E1–E9). (G) 3C experiments showing the connection between SE component enhancers (E1–E9) and DUSP1 promoter. E1, E2, and E4–E9 interacted with the promoter, and E2 and E4–E8 increased interaction frequency at 1 h after VEGFA stimulation, when DUSP1 expression peaked. n = 3. Student's t-test: (*) P-value <0.05 compared to H0. (H) Luciferase assay testing the transcriptional activity of DUSP1 component enhancers. n = 3. Student's t-test: (*) P-value <0.05 compared to H0.


