
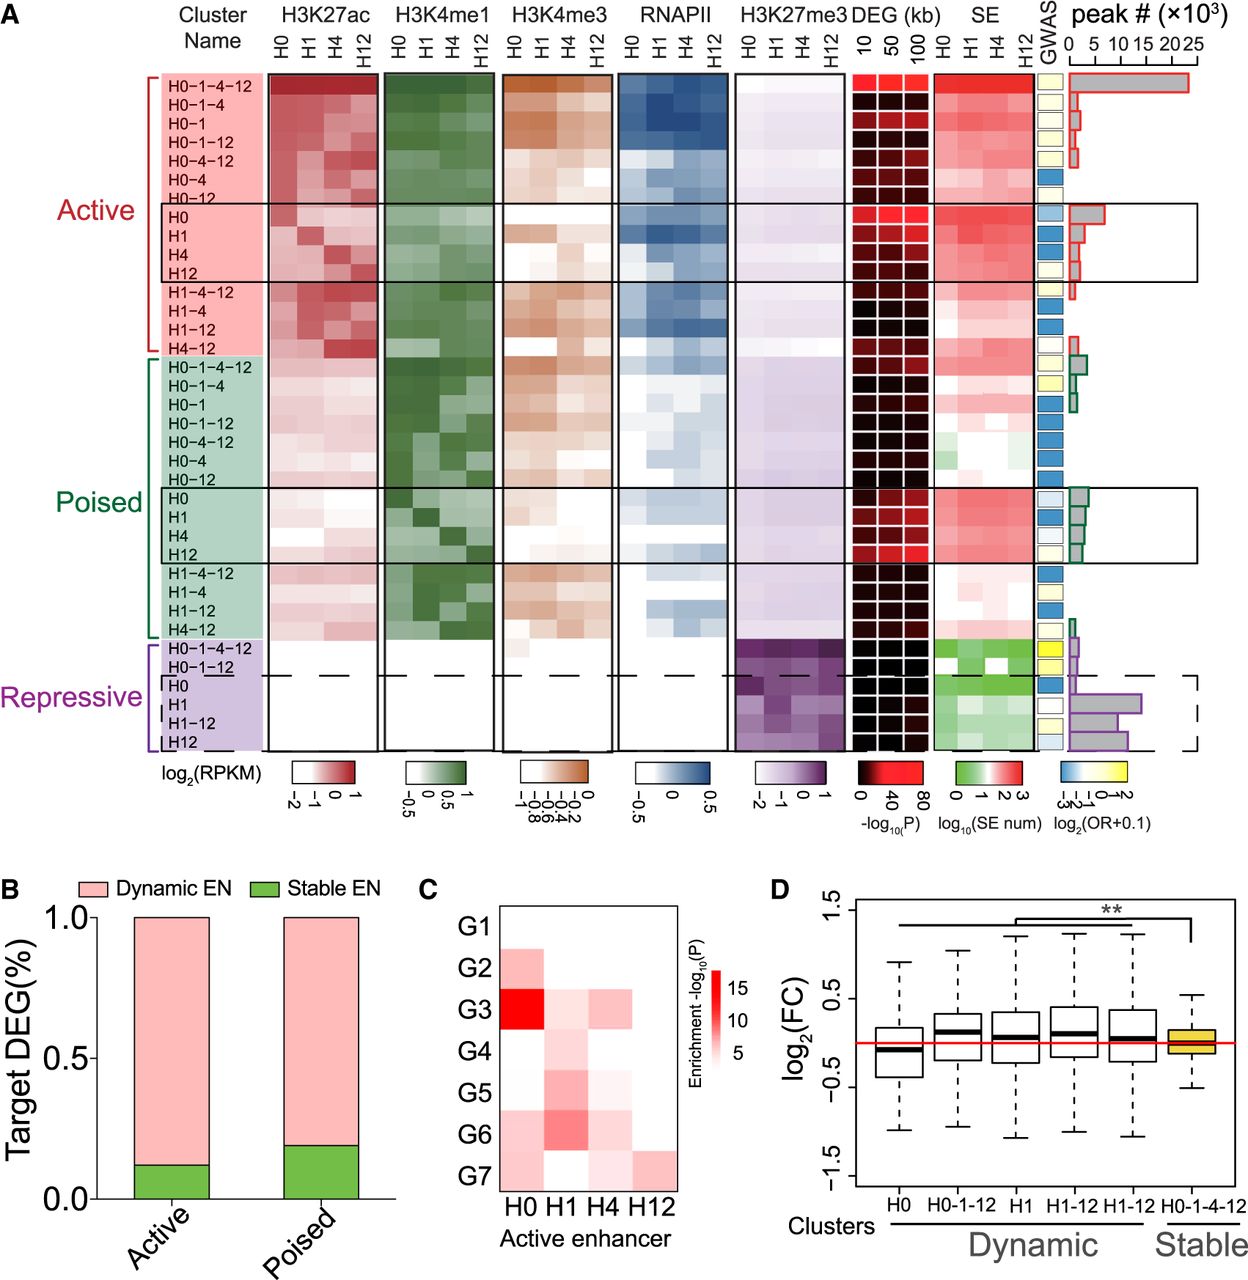
VEGFA altered the chromatin landscape at distal regulatory regions. (A) Heatmap of chromatin signatures at distal regulatory regions. Distal chromatin regions were classified into active enhancers (AEs), poised enhancers (PEs), and repressive elements (REs) based on H3K27ac, H3K4me1, and H3K27me3 occupancy (see text and Methods). Within each class of regulatory element, regions were grouped by their temporal pattern of occupancy by H3K27ac (AEs), H3K4me1 (PEs), or H3K27me3 (REs). These clusters were named by the time points in which the histone mark was present, for example, AE: H1-4 indicates an AE with H3K27ac present at 1 and 4 h. For each cluster, the average signals of H3K27ac, H3K4me1, H3K4me3, RNAP II, and H3K27me3 at each time point are displayed as a heatmap. The DEG heatmap shows the enrichment of DEGs within 10, 50, or 100 kb of the regions in the cluster. Enrichment P-values were calculated using Fisher's exact test. The super-enhancer (SE) heatmap shows the number of SEs that overlap the regions in each cluster. The GWAS heatmap shows the enrichment (odds ratio [OR]) of previously defined blood vessel–related GWAS loci in each distal regulatory element cluster. The number of regions within each cluster is displayed as a histogram at the right of the plot. (B) Percentage distribution of DEG targeted by dynamic and stable AE or PE enhancers. (C) Enrichment of members of DEG clusters among genes linked to clusters in which AEs were found at a single time point (AE clusters H0, H1, H4, and H12). Enrichment P-value was calculated using Fisher's exact test. (D) Impact of dynamic REs on gene transcription. For genes associated with indicated set of REs, the ratios of expressions were shown. The plot showed that the reduction of dynamic REs (H0, H1, H1-12, H0-1-12, H12) up-regulated their associated target genes, compared to stable REs present at all time points (H0-1-4-12). Fold change represented the ratio of RE-targeted gene FPKM at the time of RE disappearance relative to that ahead of or after RE disappearance. Wilcoxon rank-sum test was used to calculate the significance. (**) P-value <0.001.


