
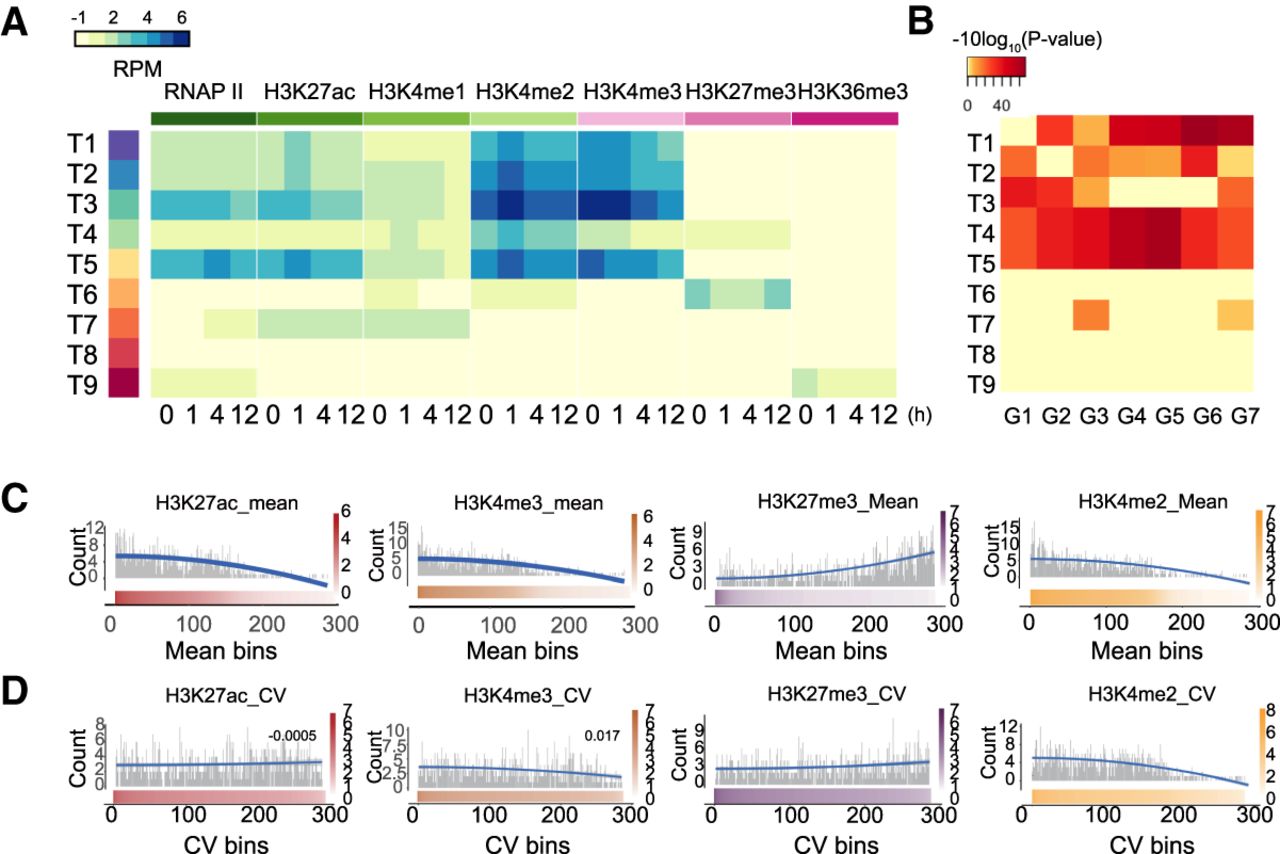
The epigenetic changes at promoters do not configure VEGFA transcriptional responses. (A) Heatmap showing promoter epigenetic signatures in HUVEC cells stimulated by VEGFA. Promoters were grouped by k-means clustering based on their temporal epigenetic signature for six histone modifications and RNAP II, as determined by ChIP-seq. Heatmap shows mean input subtracted values for promoters in each cluster. (B) Enrichment of DEG clusters (G1–G7) among genes associated with specific temporal patterns of epigenetic marks at the promoter. (T1–T9) Promoters clustered by temporal epigenetic signature. (G1–G7) DEGs clustered by temporal expression pattern (see Fig. 1A). Enrichment P-value was calculated using Fisher's exact test. Blue rectangle highlights the lack of enrichment of T3 genes in DEG clusters G4–G6. (C) Relationship between promoter histone mark signal strength and DEG frequency. Promoters were ranked by H3K27ac, H3K27me3, H3K4me2, or H3K4me3 signal strength and divided into 300 equal sized bins. The number of DEGs within each bin was plotted in gray. Red, orange, purple, and yellow color bars indicate ChIP-seq signal strength within each bin. The blue spline is the trend line of DEG counts. (D) Relationship between promoter histone mark signal variation and DEG frequency. Plot is comparable to C, except that promoters were ranked by the coefficient of variation of H3K27ac or H3K4me3 signal and divided into 300 equal sized bins. The number of DEGs within each bin was plotted in gray. Red, orange, purple, and yellow color bars indicate ChIP-seq signal variation within each bin. The blue spline is the trend line of DEG counts.


