
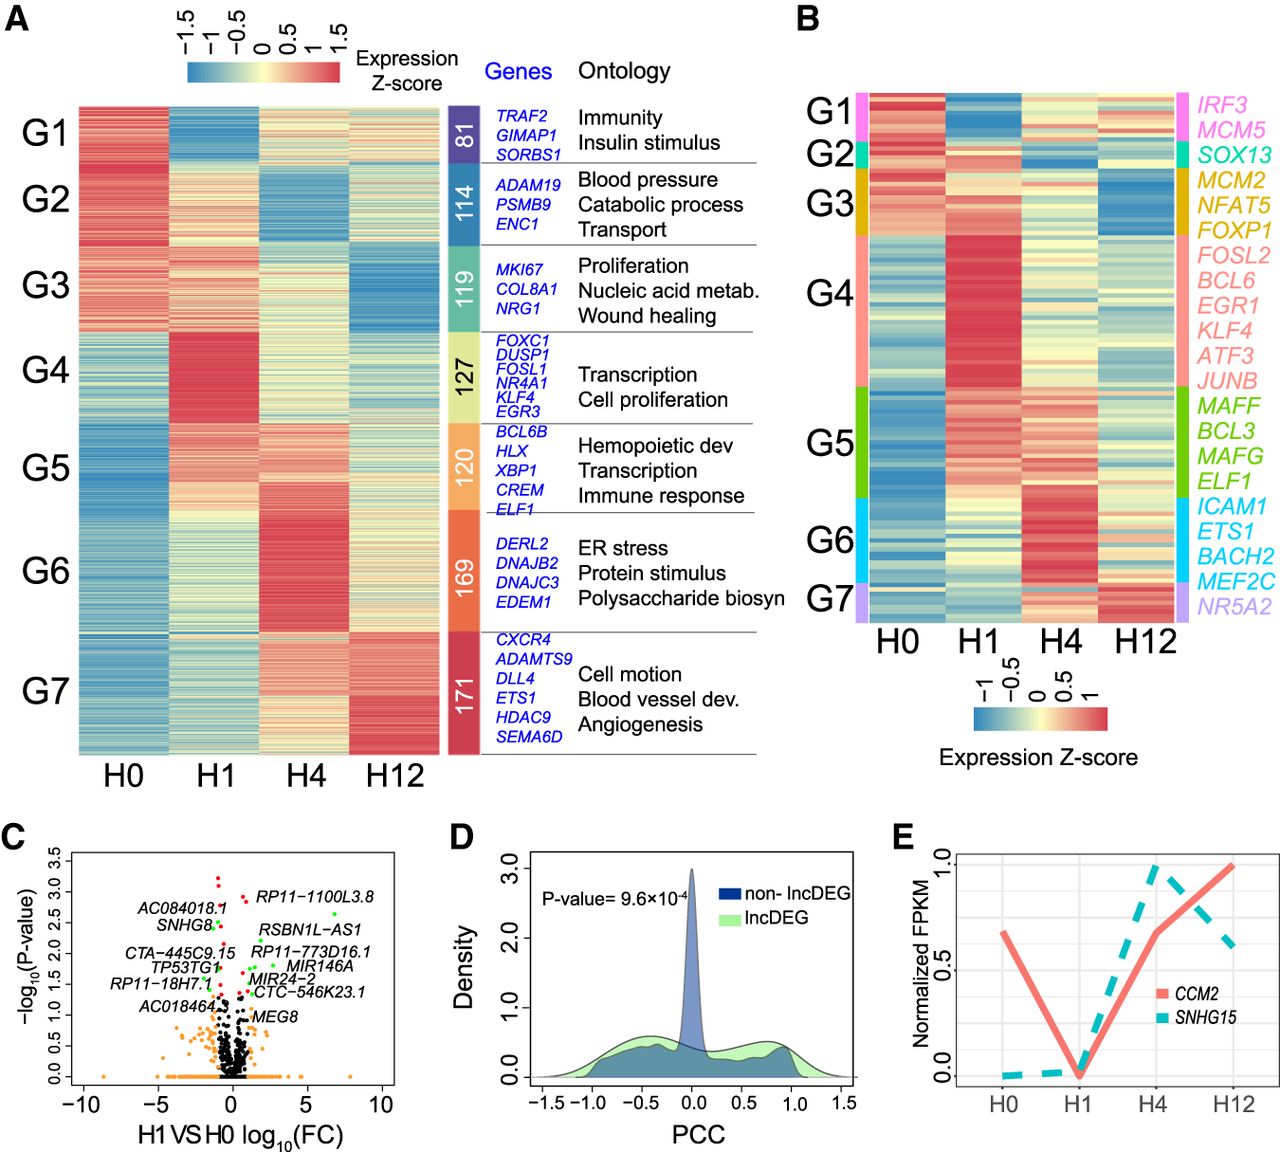
Dynamic transcriptome changes induced by VEGFA in HUVECs. (A) Heatmap of differentially expressed genes [DEGs; fold change compared with baseline (H0) ≥2, two biological replicates per time point]. HUVECs were treated with VEGFA for 0 (untreated), 1, 4, and 12 h, and gene expression was profiled by mRNA-seq. Genes were separated into seven clusters according to their temporal expression pattern. Gene number, representative genes, and selected enriched Gene Ontology terms for each cluster are listed to the right. (B) Heatmap of differentially expressed TFs. Representative TFs are listed on the right. (C) Volcano plots of expressed lncRNAs. Dots are colored by differential expression compared to baseline: (green) FC ≥ 2 or FC ≤ 0.5 and P-value <0.05; (beige) FC ≥ 2 or FC ≤ 0.5 and P-value ≥0.05; (red) 0.5 < FC < 2 and P-value <0.05. (D) Correlation of expression of lncDEGs to their potential target genes. The curves indicate the distribution of Pearson correlation coefficients (PCCs) between expression of lncDEGs and their potential target genes. The Kolmogorov–Smirnov test P-value comparing the distributions for neighboring target genes and randomly selected genes (excluding neighboring genes) is shown. (E) Expression of lncRNA SNHG15 and its adjacent gene CCM2 during the VEGFA stimulation time course, illustrating a positive correlation between a lncRNA-adjacent gene pair over time.


