
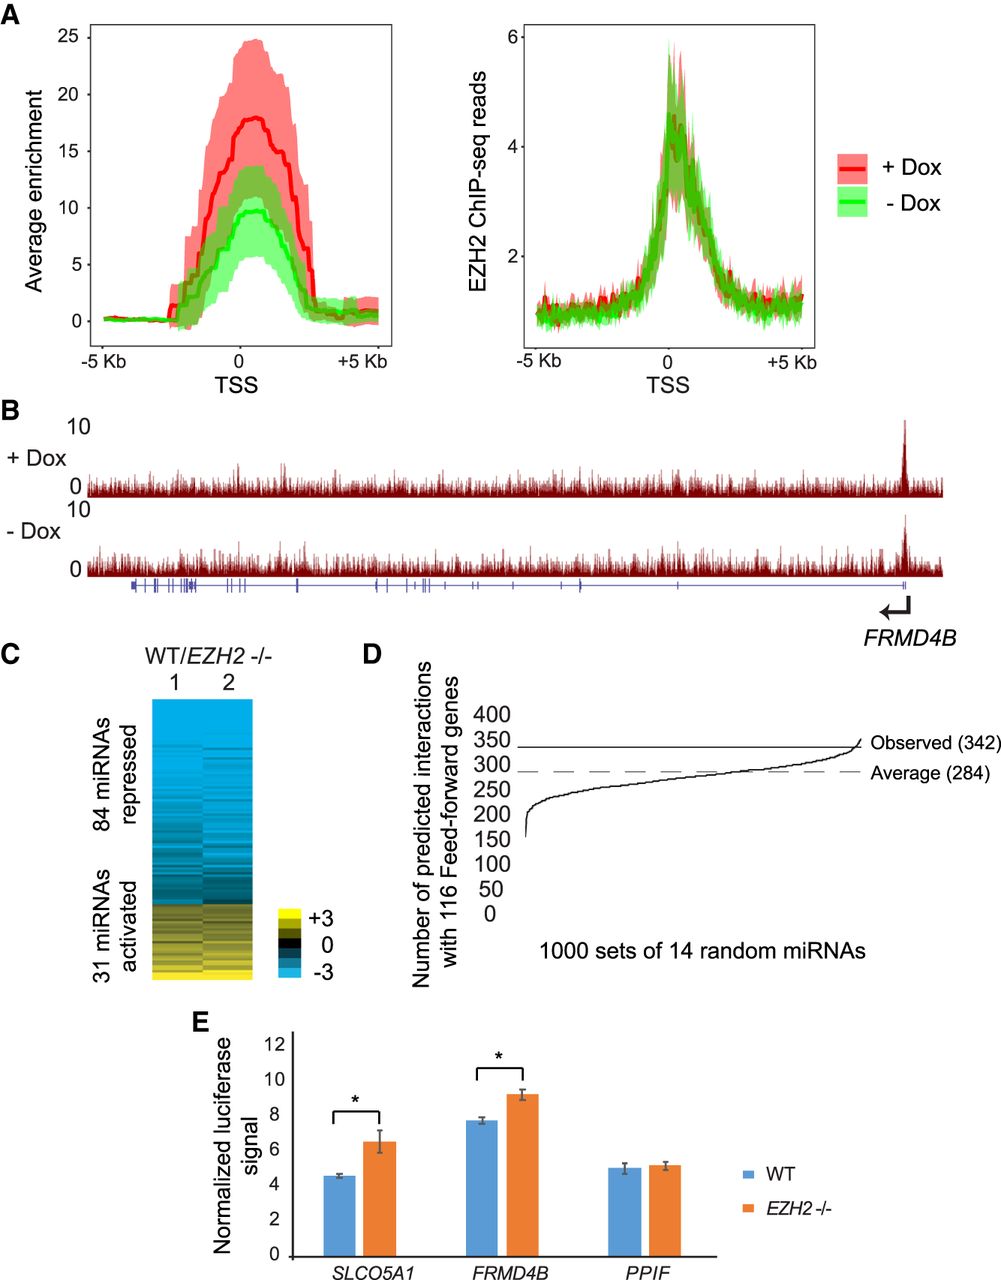
(A) Normalized density of EZH2 ChIP enrichment scores (−log10 Q-value calculated using MACS2, left) and EZH2 ChIP-seq reads (right) in the 10-kb region spanning the TSS of the feed-forward regulated genes in cells treated with Dox (+ Dox) and untreated (− Dox). (B) Genome Browser view of FRMD4B showing tracks for EZH2 ChIP-seq in WT +Dox and WT −Dox cells containing VP55. (C) Heat map showing differential expression of miRNAs in response to EZH2 knockout. Rows are ordered from low to high log2 fold change between WT and EZH2−/− miRNA counts. (D) Predicted interactions between 1000 random sets of 14 miRNAs and feed-forward regulated genes. The average across 1000 intersections is marked “Average.” The number of observed interactions between EZH2-activated miRNAs and feed-forward regulated genes is marked “Observed.” P-value = 0.024 was calculated using the bootstrap method (Methods). (E) Luciferase assay comparing miRNA inhibition of WT 3′ UTR transfected into WT and EZH2−/− cells.


