
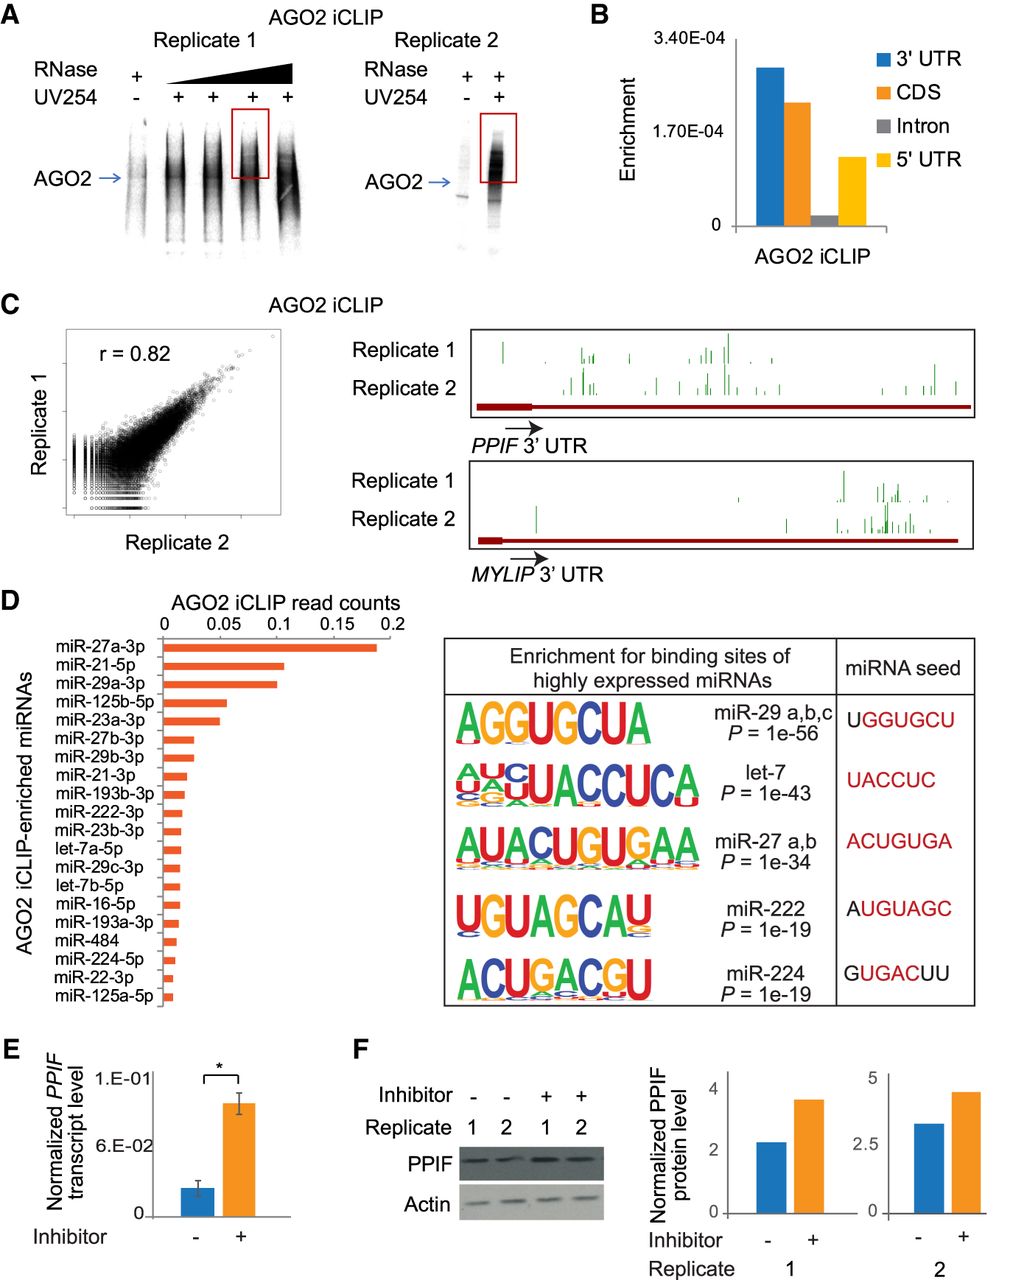
Identification of miRNA targets by AGO2 iCLIP. (A) Autoradiograph showing AGO2-crosslinked ribonucleoprotein complexes from two replicates. The red box represents the region that was processed to make cDNA libraries. (B) Genomic enrichment of AGO2-crosslinked reads mapping to mRNAs. The plot shows total reads mapped to a genomic feature, normalized to the total length of the feature in the genome. (C) Correlation of the total reads mapping to genes between the two independent replicates of AGO2 iCLIP (left). Genome Browser images showing AGO2 iCLIP peaks at 3′ UTRs for two protein-coding genes (right). (D) AGO2-interacting miRNAs plotted in descending order of read coverage (left). Sequences enriched proximal to AGO2 iCLIP peaks on mRNAs that significantly match the binding sequence for AGO2-interacting miRNAs. Corresponding miRNA seed sequences are also shown (right). (E) PPIF transcript levels in U87MG cells treated with negative control inhibitor or miR-23a-3p inhibitor. Error bars represent standard error across four replicates (two biological and two technical). (*) P < 0.05, paired t-test. (F) PPIF protein levels in U87MG cells treated with negative control inhibitor or miR-23a-3p inhibitor. The immunoblot showing two independent replicates (left) was quantified using ImageJ (right).


