
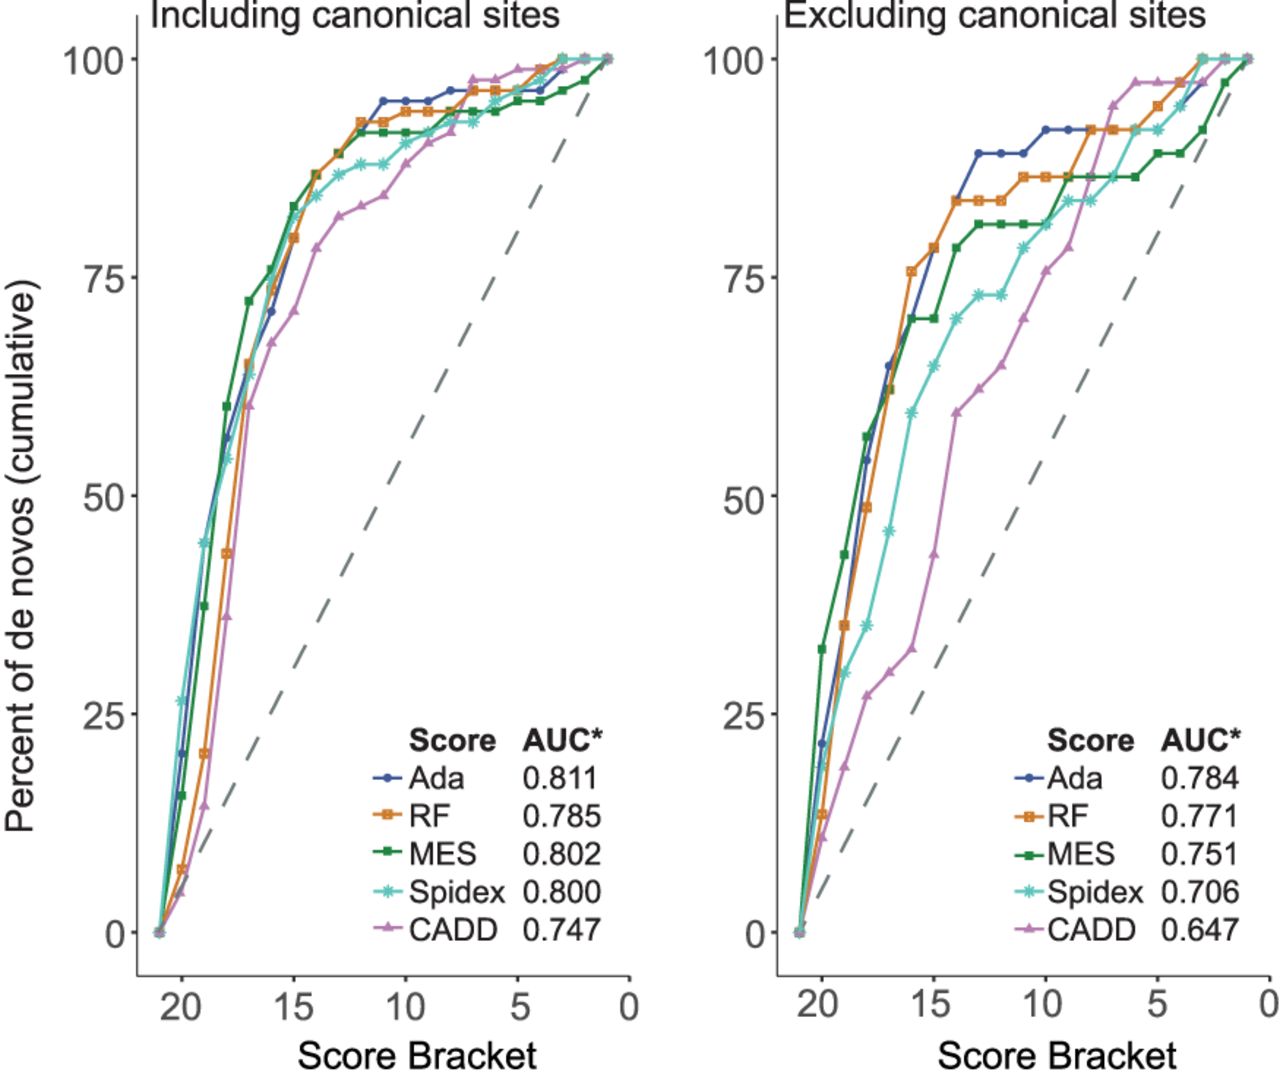
Figure 5.
Pathogenicity scores for observed near-splice site DNMs. Cumulative percentage of DNMs in known dominant DD genes with decreasing pathogenicity score bracket, shown with canonical splice site positions included (left) and excluded (right). (AUC*) area under curve.


